GREEN ANTI-STOKES PHOSPHOR LED CIRCA. 1967 FROM THE U.S.S.R.
There are at least 31 images on this web page; somebody set up us the bomb.
Dial-up users please allow for slightly extended load time.
Last updated 10-20-2020
These amazing pictures show a very rare anti-Stokes phosphor green LED from Russia -- back then known as the USSR.
The LEDs are reported to have a Vf (forward voltage) of +1.70 volts at an If (forward current) of 10mA.
My physical measurements:
5.30mm T
4.60mm dia. (not incl. flange)
5.40mm dia. (incl. flange)
I measured the LED's, "out the front" power at less than 1mW at an If=150mA; this tells me that almost all of the LED's native NIR radiation is being absorbed by the anti-Stokes phosphor layer.
I have confirmed that my testing methodology is sound; I irradiated the same thermoelectric sensor used in the above test with a modern NIR LED at If=150mA and received a power output of 60mW.
Photograph of the LED itself.
Another photograph of the LED itself.
That "foggy" appearance is because I affixed some toliet paper to the camera's flash in attempt to mute it a bit; the flash's close proximity to the camera's lens resulted in some unwanted light "leakage".
Another photograph of the LED itself.
I took this one in direct sunlight and held a pair of +4 diopter reading glasses up to the camera's lens in effort to enhance focusing at near-macro distances.
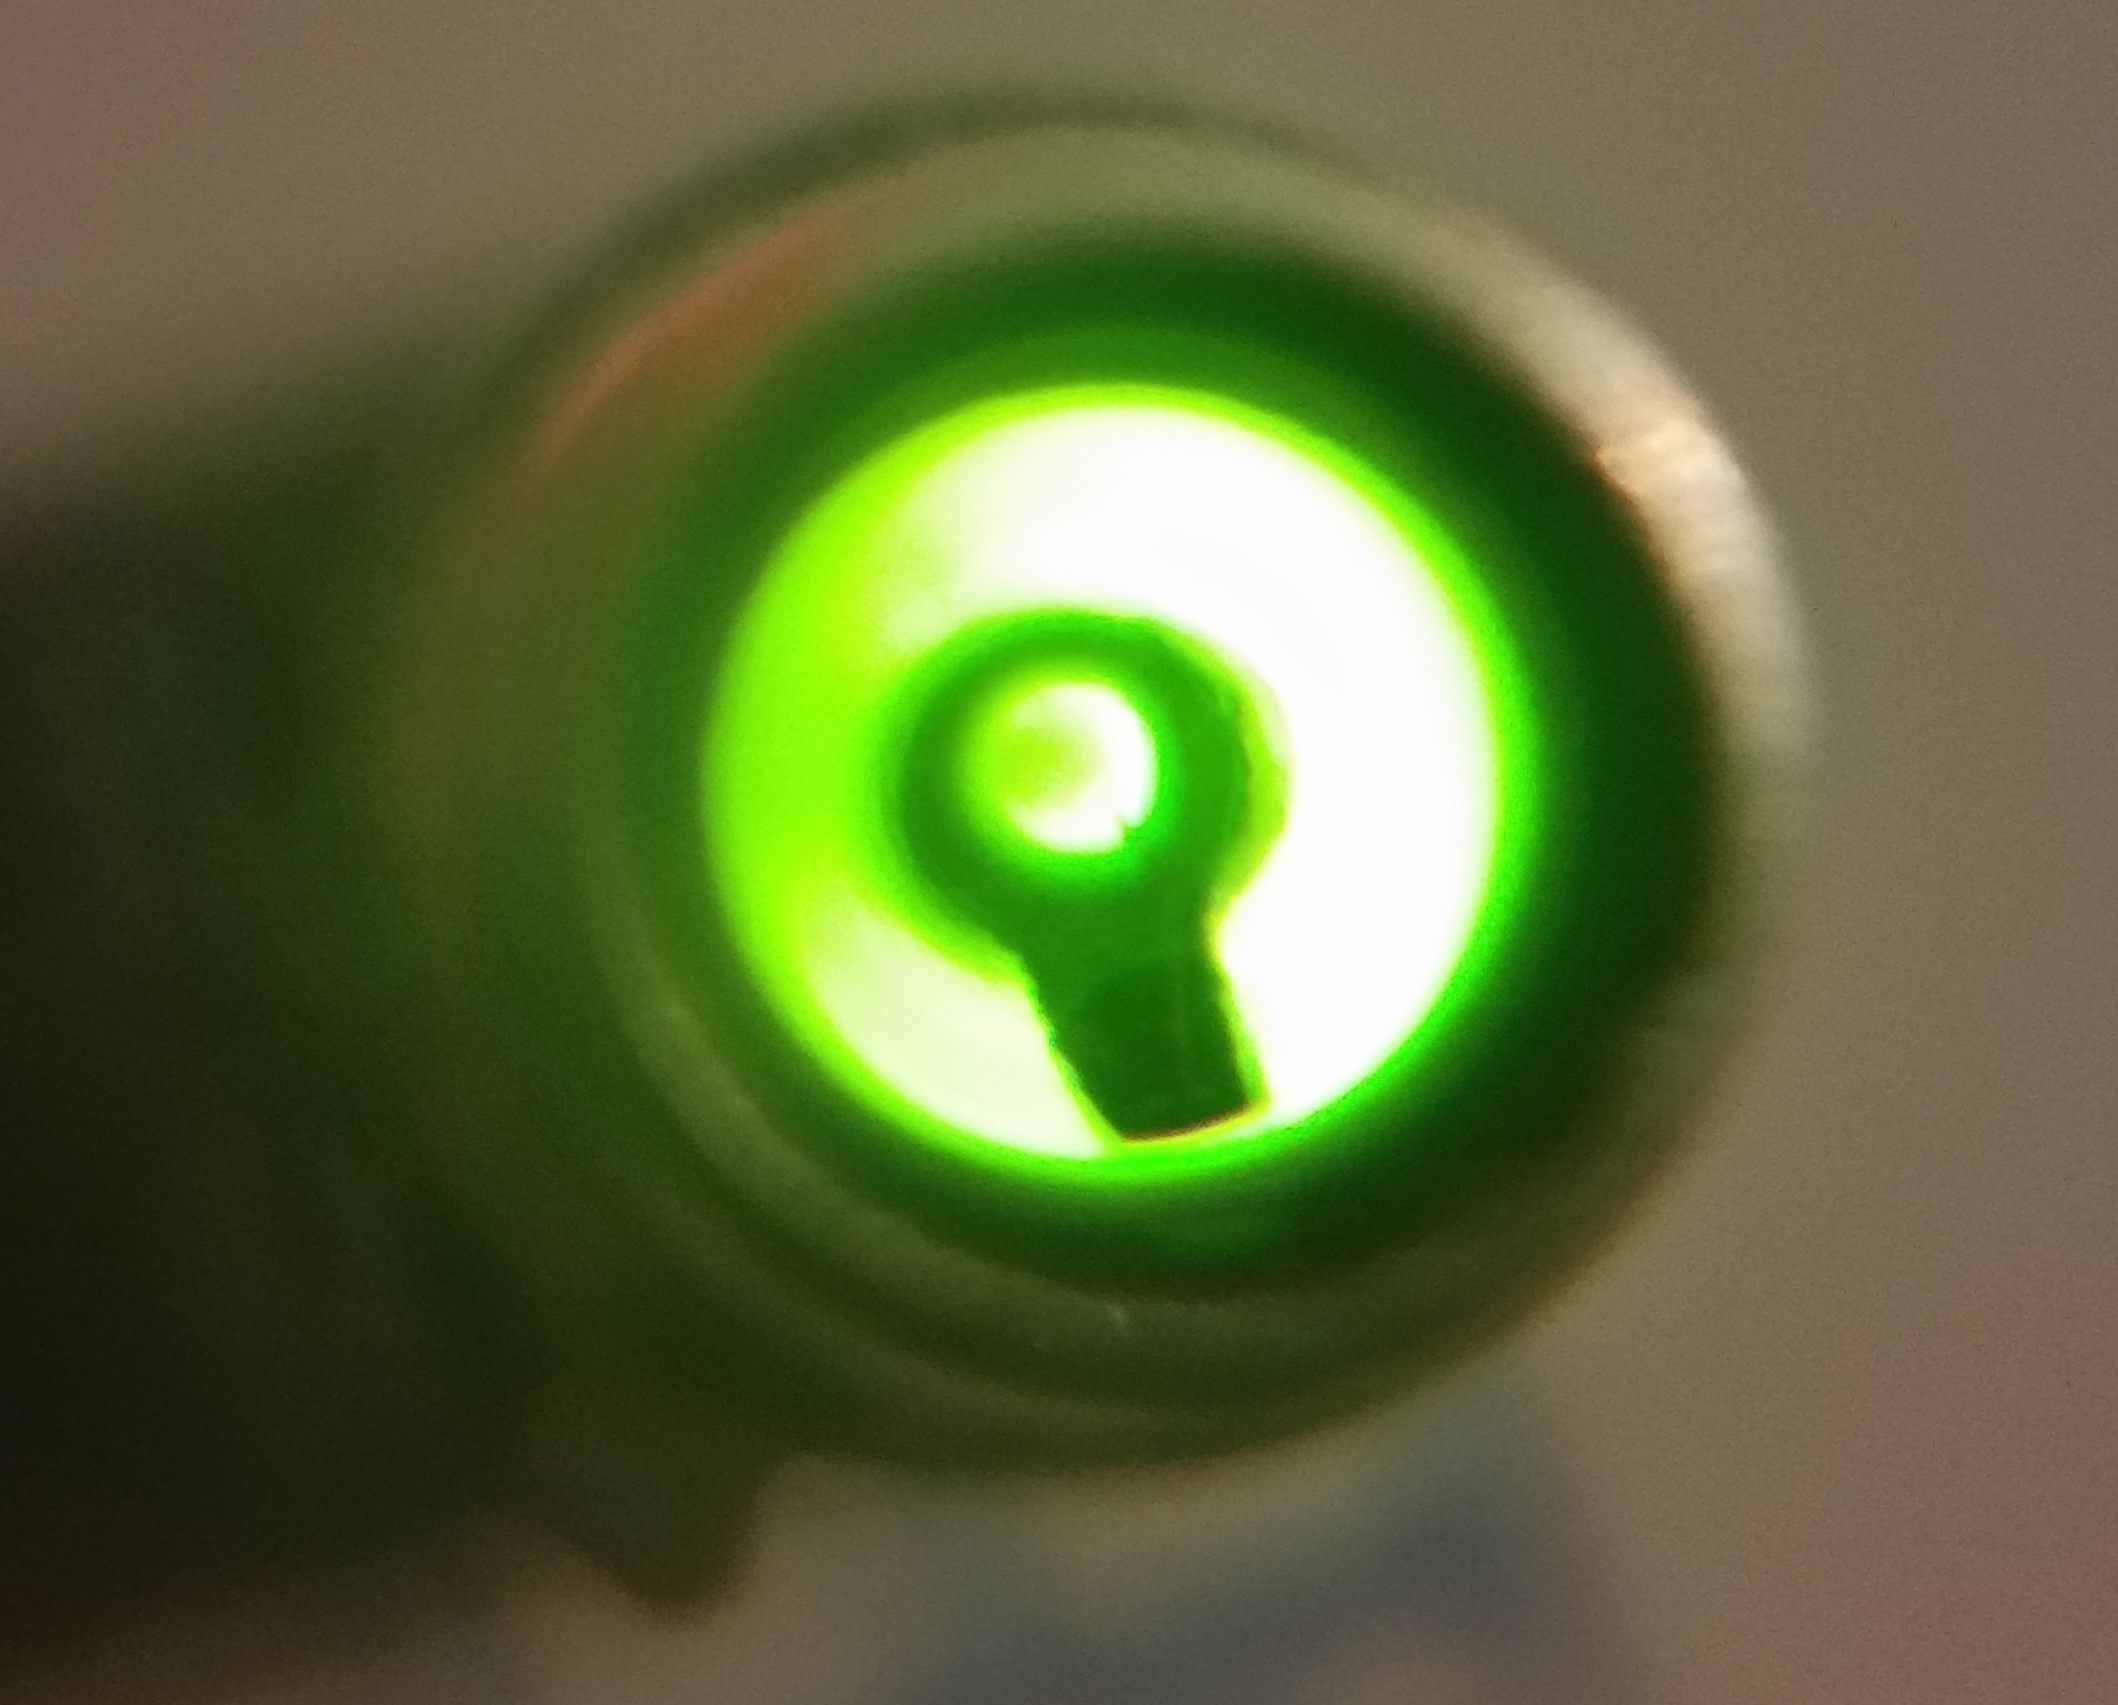
Photograph "looking down the barrel" as it were with the LED being fed 2mA.
Photograph "looking down the barrel" as it were with the LED being fed 30mA.
This photograph was taken outdoors in shade plus I held a pair of +4 diopter reading glasses up to the camera's lens in effort to enhance focusing at near-macro distances.
Photo comparing this LED in size to a modern (2020) 5mm (T1¾) through-hole epoxy LED.
I must apologise for the furry pix; my last "good" camera was on a drone that was stolen approx. 14 months ago as of this writing (07-25-20); I was forced to use the camera inbuilt into my cellular telephone handset.
Manufactured sometime between 1967 and 1968, this green LED gets its light from a GaAs (gallium arsenide) near-infrared-emitting LED die (chip) (emission wavelength ~940nm) over which an anti-Stokes (aka. upconverting) phosphor has been applied; this phosphor (typically made of barium yttrium oxysulfide doped with gadolinium oxysulfide) converts the NIR radiation from the LED's native emission into GREEN visible light.
In this LED's case, a red-emitting phosphor was also added in an attempt to boost the LED's intensity.
According to a number of pages I found online, this is described as a, "fluorescent LED".
I find this statement to in fact be accurate; the way that this LED functions is not too unlike the way that fluorescent light bulbs work.
Although the is reported to have the dual (green & red) phosphor formulation, this LED is marked as the and it also has the dual phosphor formulation when it is actually described as only having the green-emitting phosphor -- the BaYF5.
The green and red phosphors are suspected to be BaYF5 and Y3OCL7 respectively.
As far as I am aware, this LED predates green-emitting LEDs that produce green light directly without the need for phosphor upconversion -- thus making it the world's first green-emitting LED!
As you can see by the photographs, these LEDs came in TO-5 metal transistor cans with a glass lens on the end.
Spectrographic analysis of one of these LEDs.
Spectrographic analysis of one of these LEDs; spectrometer's response narrowed to a band between 545nm and 565nm to pinpoint green phosphor emission peak wavelength, which is 555.640nm.
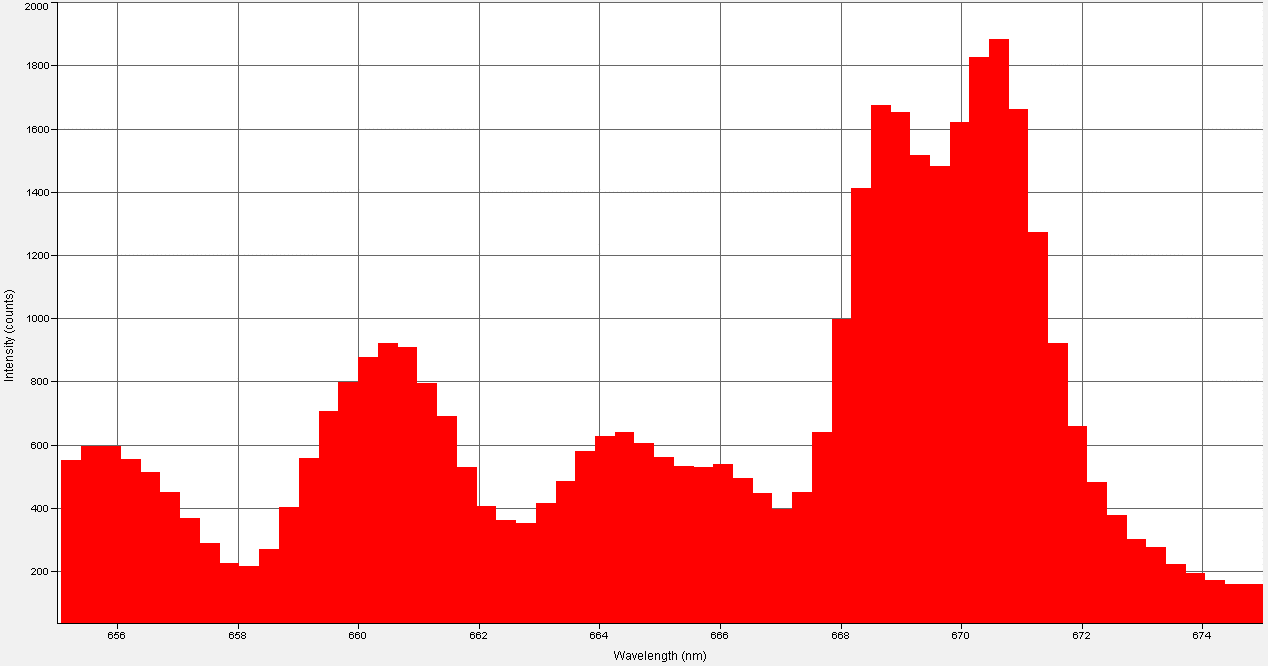
Spectrographic analysis of one of these LEDs; spectrometer's response narrowed to a band between 660nm and 680nm to pinpoint red phosphor emission peak wavelength, which is 671.440nm.
Spectrographic analysis of one of these LEDs; spectrometer's response narrowed to a band between 780nm and 874nm (which is the deepest in the IR that my spectrometer can dig into) to resolve several queer NIR emissions.
LED was driven at 70mA this time.
The raw spectrometer data (tab-delimited that can be loaded into Excel) is at asgreen.txt
Spectrographic analysis of one of these LEDs (If=2mA); spectrometer's response narrowed to a band between 545nm and 565nm to pinpoint green phosphor emission peak wavelength, which is 553.940nm.
Spectrographic analysis of one of these LEDs (If=2mA); spectrometer's response narrowed to a band between 655nm and 675nm to pinpoint red phosphor emission peak wavelength, which is 670.460nm.
This shows that decreasing the If lengthens the wavelength.
The raw spectrometer data (tab-delimited that can be loaded into Excel) is at asgreen3.txt
Spectrographic analysis of one of these LEDs (If=150mA); spectrometer's response narrowed to a band between 545nm and 565nm to pinpoint green phosphor emission peak wavelength, which is 552.910nm.
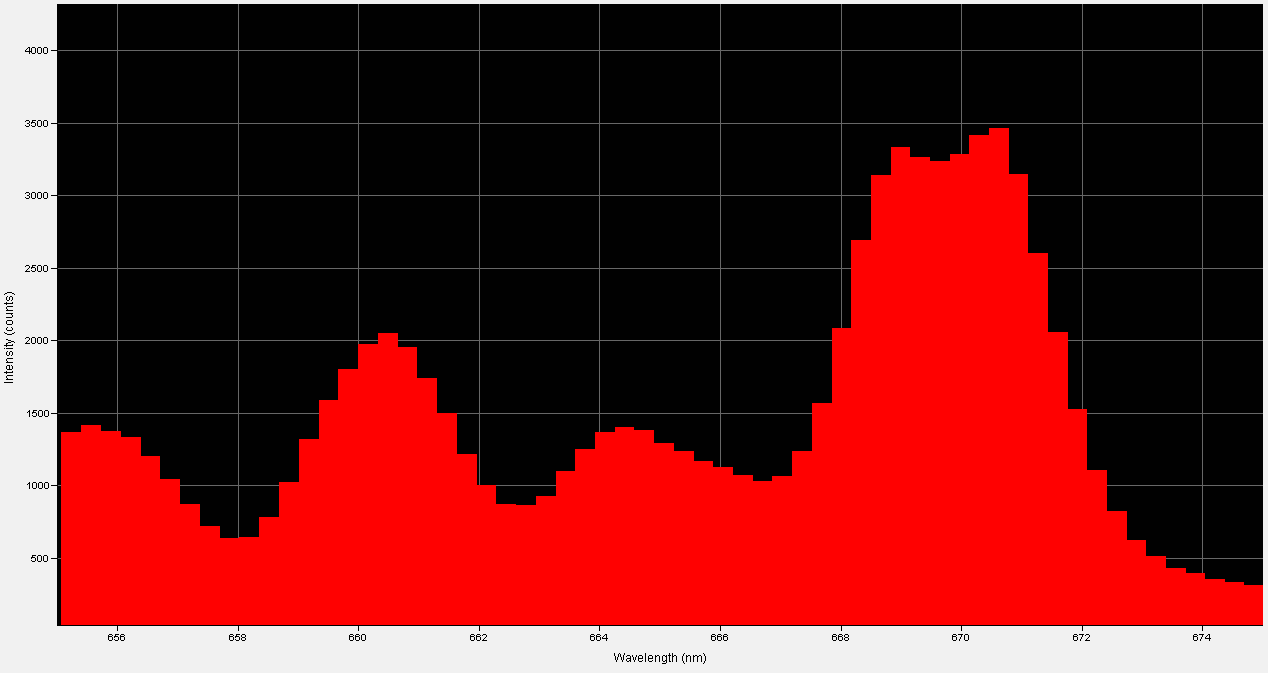
Spectrographic analysis of one of these LEDs (If=150mA); spectrometer's response narrowed to a band between 655nm and 675nm to pinpoint red phosphor emission peak wavelength, which is 659.670nm.
This shows that increasing the If shortens the wavelength.
The raw spectrometer data (tab-delimited that can be loaded into Excel) is at asgreen2.txt
Spectrographic analysis of one of these LEDs at If=10mA from a different batch to see if the red phosphor emission goes away (it didn't).
Spectrographic analysis of one of these LEDs at If=10mA from a different batch; spectrometer's response narrowed to a band between 545nm and 565nm to pinpoint green phosphor emission peak wavelengths, which are 547.790nm and 553.940nm.
Spectrographic analysis of one of these LEDs at If=10mA from a different batch; spectrometer's response narrowed to a band between 655nm and 675nm to pinpoint red phosphor emission peak wavelength (of the highest peak), which is 660.660nm.
The raw spectrometer data (tab-delimited that can be loaded into Excel) is at asgreen3.txt
Spectrographic analysis of one of these LEDs at If=150mA from a different batch.
Spectrographic analysis of one of these LEDs at If=150mA from a different batch; spectrometer's response narrowed to a band between 540nm and 560nm to pinpoint green phosphor emission peak wavelengths, which are 547.100nm and 553.250nm.
Spectrographic analysis of one of these LEDs at If=150mA from a different batch; spectrometer's response narrowed to a band between 655nm and 675nm to pinpoint red phosphor emission peak wavelength (of the highest peak), which is 660.00nm.
The expected level of wavelength drift did not occur with the LED randomly selected from this batch; I have no explanation so please save your breath (don't ask).
The raw spectrometer data (tab-delimited that can be loaded into Excel) is at asgreen4.txt
Spectrographic analysis of one of these LEDs (randomly cut from the packaging materials) at If=10mA.
I just wanted to see if the red phosphor emission was present in this sample. Yup, there it is.
Spectrographic analysis of another one of these LEDs (randomly cut from the packaging materials) at If=10mA.
I just wanted to see if the red phosphor emission was present in this sample. Yup, there it is.
Spectrographic analysis of another one of these LEDs (randomly cut from a second package of these LEDs) at If=10mA.
I just wanted to see if the red phosphor emission was present in this sample. Yup, there it is.
Spectrographic analysis of another one of these LEDs (randomly cut from a second package of these LEDs) at If=150mA.
Look at the emission in the blue and especially the violet.
I'm uncertain whether this is a true phosphor emission (this ***IS*** an anti-Stokes phosphor that we're dealing with here!) or a harmonic in the spectrometer's grating.
The raw spectrometer data (tab-delimited that can be loaded into Excel) for the wavelength range of 380nm to 470nm is at asgreen5.txt
Spectrographic analysis of another one of these LEDs (randomly cut from a second package of these LEDs) at If=150mA.
Look at the emission in the violet.
Peak wavelength here is 412.150nm.
I'm again uncertain whether this is a true phosphor emission (this ***IS*** an anti-Stokes phosphor that we're dealing with here!) or a harmonic in the spectrometer's grating.
The raw spectrometer data (tab-delimited that can be loaded into Excel) for the wavelength range of 380nm to 470nm is at asgreen6.txt
Spectrographic analysis of another one of these LEDs (randomly cut from a second package of these LEDs) at If=150mA.
Look at the emission in the violet.
There are two peaks in the violet: one at 408.93nm and another at 411.43nm.
I've been informed by an expert that this is probably *REAL* emission rather than grating harmonics from the spectrometer.
The raw spectrometer data (tab-delimited that can be loaded into Excel) for the wavelength range of 175nm to 480nm is at asgreen7.txt
Spectrographic analysis of another one of these LEDs (randomly cut from a second package of these LEDs) at If=150mA; wavelength narrowed to a band between 175nm and 500nm this time.
Spectrographic analysis.
Again, look at the emission in the violet.
There are two peaks in the violet: one at 409.29nm and another at 411.79nm.
The raw spectrometer data (tab-delimited that can be loaded into Excel) for the wavelength range of 175nm to 500nm is at asgreen8.txt
These LEDs were being offered on Ebay in early-April 2020; so I rather swiftly took the bate.
I finally received them on the afternoon of 07-24-20.
This link offers up a bit of information about these vintage -- actually ANTIQUE LEDs.
Do you manufacture or sell an LED flashlight, task light, utility light, or module of some kind?
Want to see it tested by a real person, under real working conditions? Do you then want to see how your light did? If you have a sample available for this type of
real-world, real-time testing, please contact me at bdf1111@yahoo.com.
Unsolicited flashlights, LEDs, and other products appearing in the mail are welcome, and it will automatically be assumed that you sent it in order to have it tested and evaluated for this site.
Be sure to include contact info or your company website's URL so visitors here will know where to purchase your product.
This page is a frame from a website. If you arrived on this page through an outside link,you can get the "full meal deal" by clicking here.