Shenzhen Saiju Electronics Co., Ltd.
Part # SJ-P001SWDX-XXXP
Received 07-27-12, tested 09-13-12
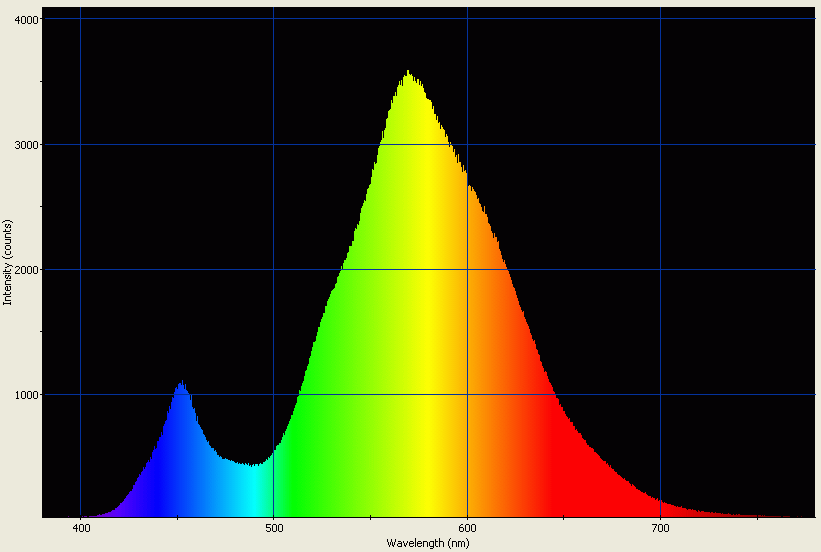
Spectrographic analysis of sample 1 of this LED.
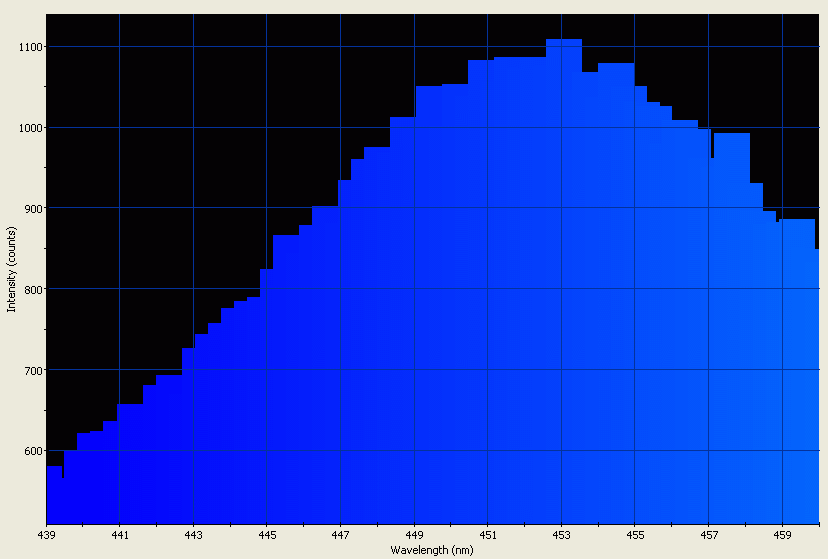
Spectrographic analysis of sample 1 of this LED; spectrometer's response narrowed to a band between 439nm and 460nm to pinpoint native peak wavelength, which is 452.660nm.
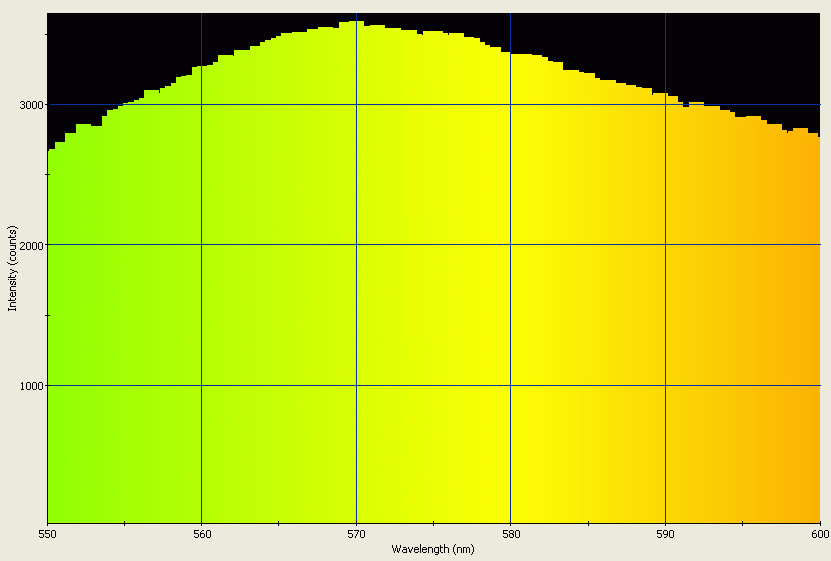
Spectrographic analysis of sample 1 of this LED; spectrometer's response narrowed to a band between 550nm and 600nm to pinpoint phosphor emission peak wavelength, which is 569.777nm.
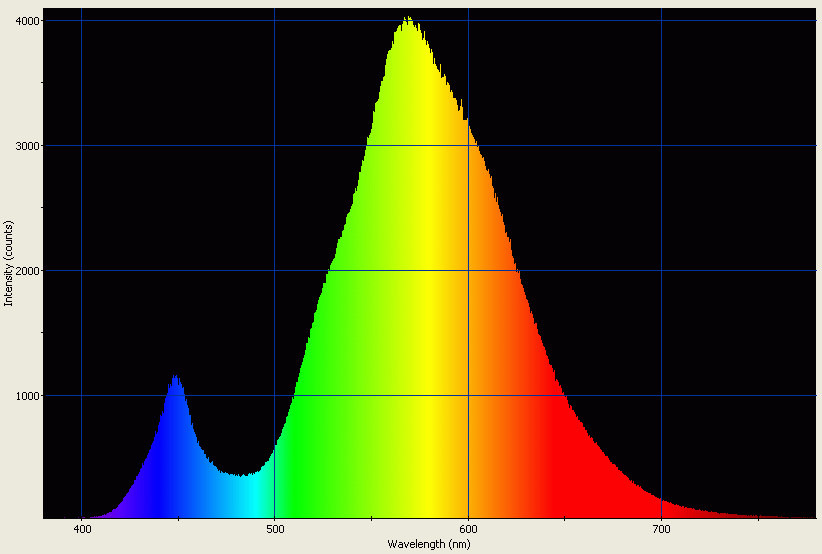
Spectrographic analysis of sample 2 of this LED.
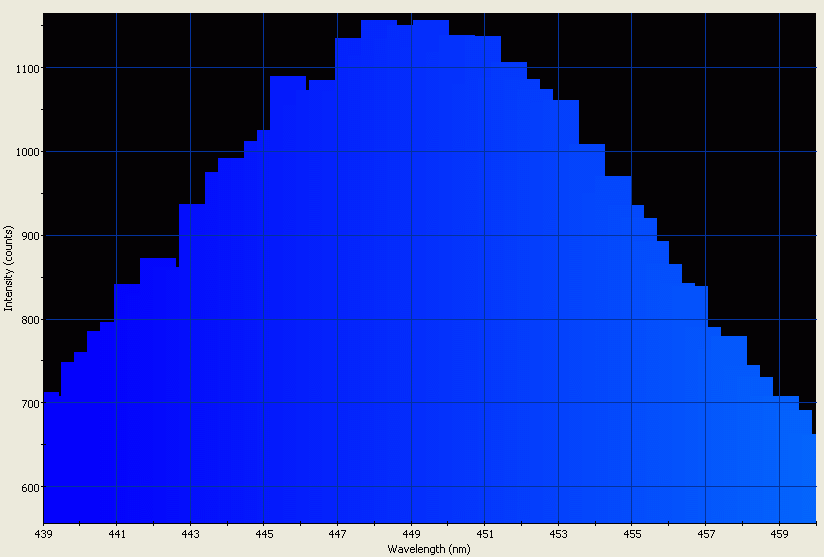
Spectrographic analysis of sample 2 of this LED; spectrometer's response narrowed to a band between 439nm and 460nm to pinpoint native peak wavelength, which is 447.693nm.
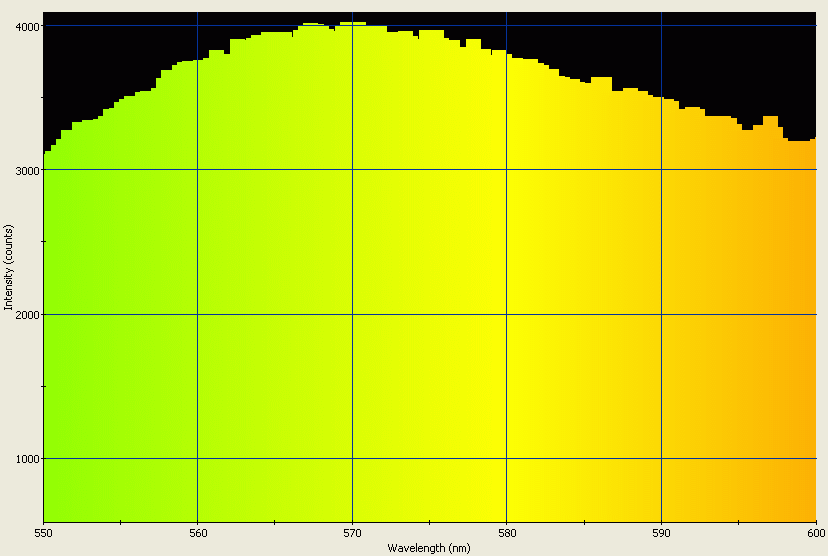
Spectrographic analysis of sample 2 of this LED; spectrometer's response narrowed to a band between 550nm and 600nm to pinpoint phosphor emission peak wavelength, which is 569.629nm.
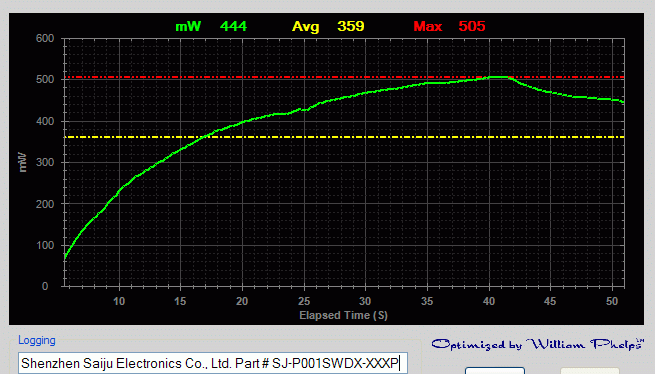
Power output analysis of sample 1 of this LED.
Tops out at 505mW.
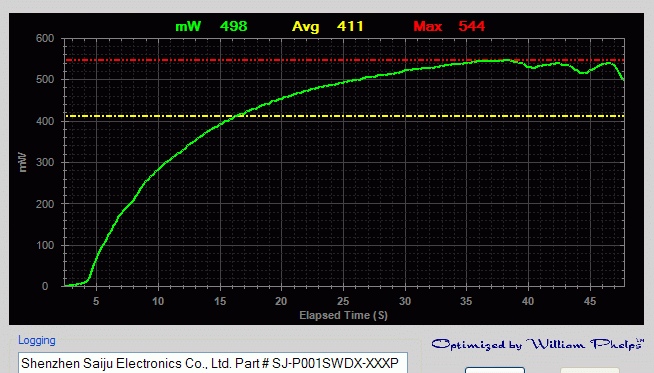
Power output analysis of sample 2 of this LED.
Tops out at 544mW.
Shenzhen Fedy Technology Co., Ltd.
Part # FD-12R20-Y1
Received 07-27-12, tested 08-30-12
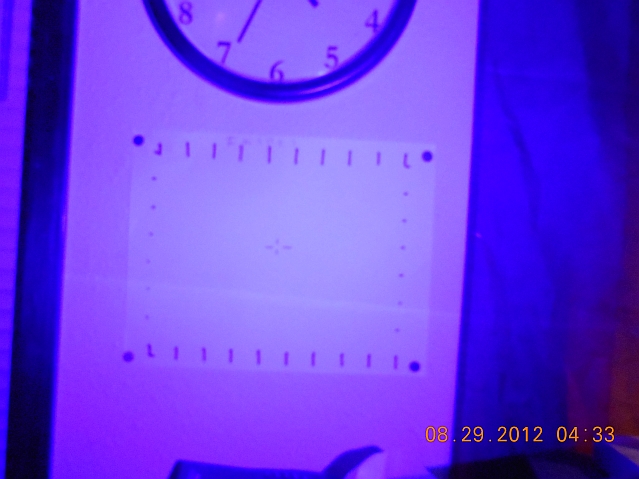
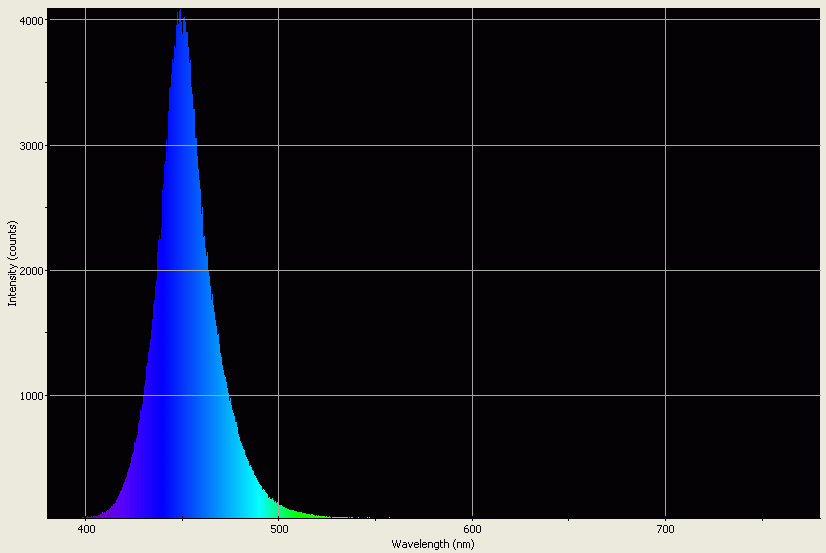
Spectrographic analysis of sample 1 of this LED.
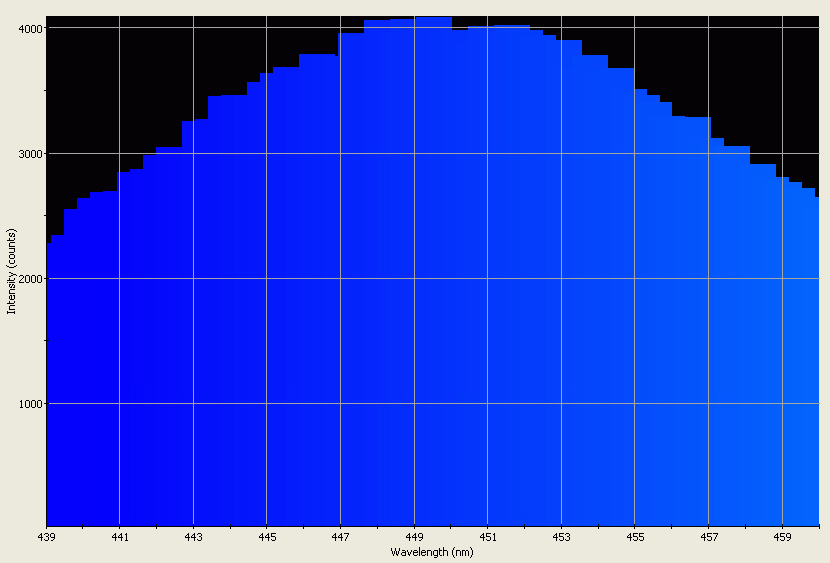
Spectrographic analysis of sample 1 of this LED; spectrometer's response narrowed to a band between 439nm and 460nm to pinpoint peak wavelength, which is 449.088nm.
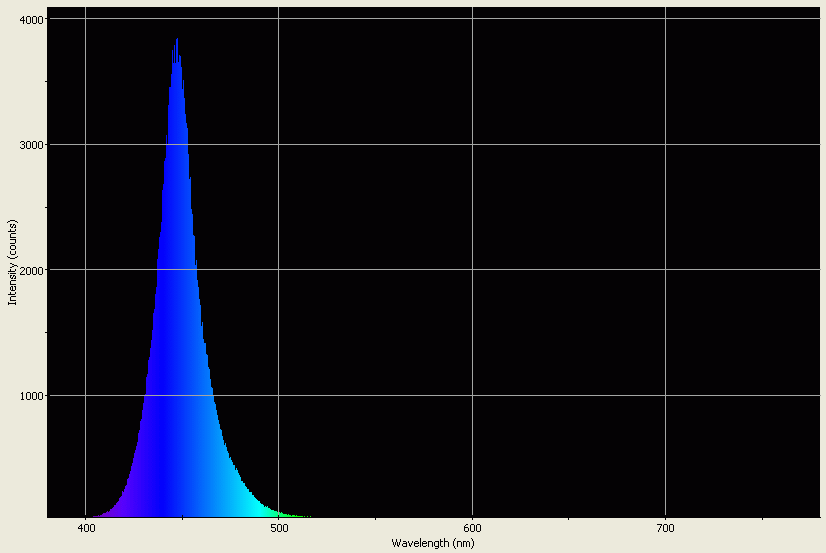
Spectrographic analysis of sample 2 of this LED.
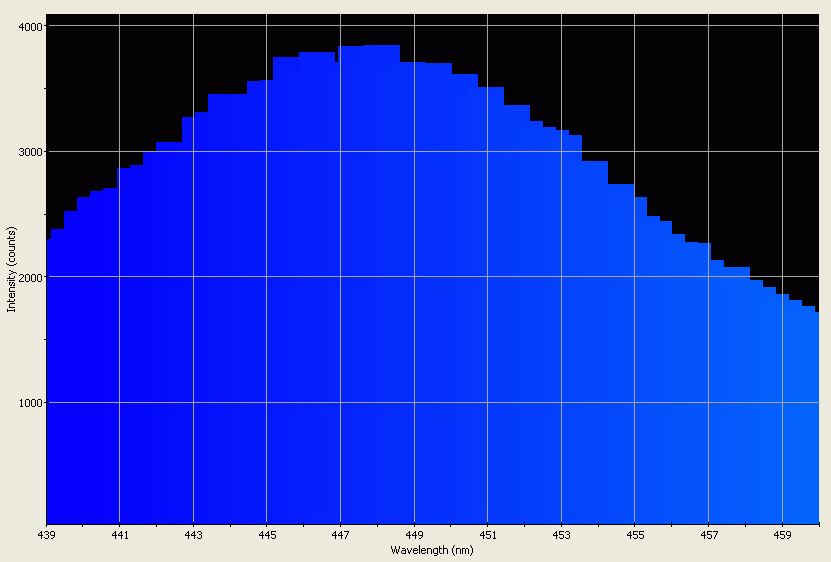
Spectrographic analysis of sample 2 of this LED; spectrometer's response narrowed to a band between 439nm and 460nm to pinpoint peak wavelength, which is 447.693nm.
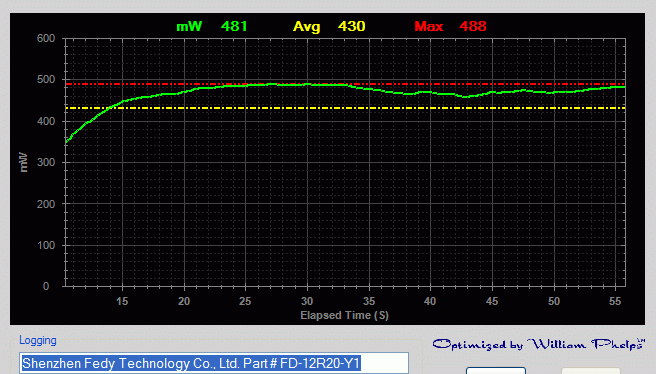
Power output analysis of sample 1 of this LED.
Tops out at 687mW.
The chart starts to fall off not because the LED became a DED (Dark-Emitting Diode), but because I pressed the wrong key on the keyboard when I attempted to perform a screen dump and then neutralised the power supply because I do not have a heatsink for the LED.
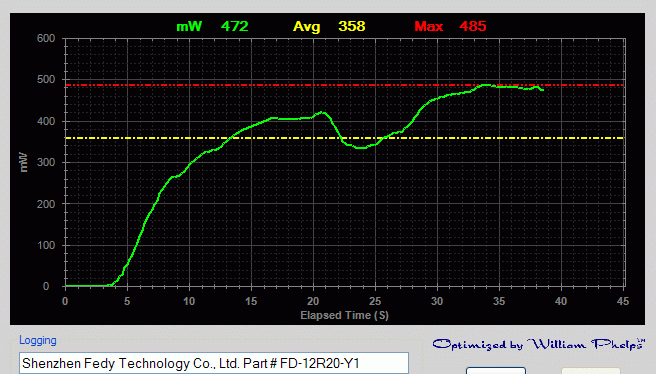
Power output analysis of sample 2 of this LED.
Tops out at 795mW.
Luckysunny Photoelectricity (HK) Technology Co., Ltd.
Part # LSP-830B1-WW
Received 07-27-12, tested 08-12-12
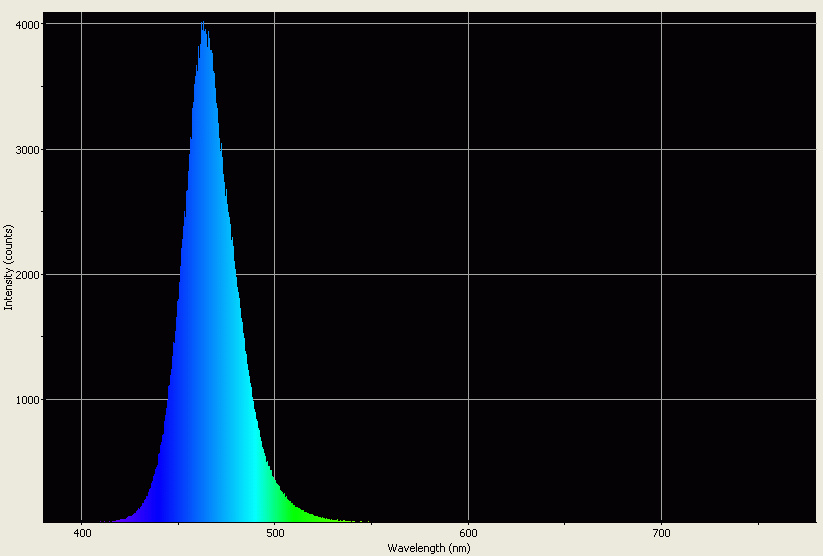
Spectrographic analysis of sample 1 of this LED.
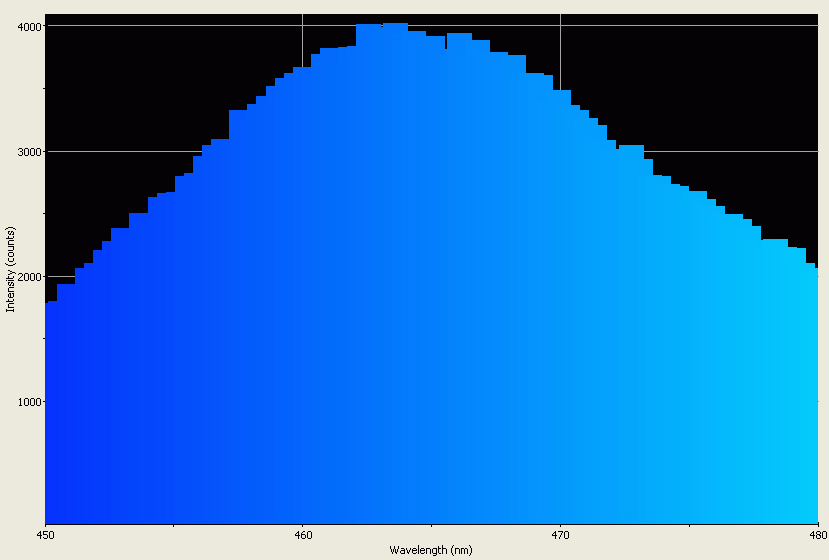
Spectrographic analysis of sample 1 of this LED; spectrometer's response narrowed to a band between 450nm and 480nm to pinpoint peak wavelength, which is 463.907nm.
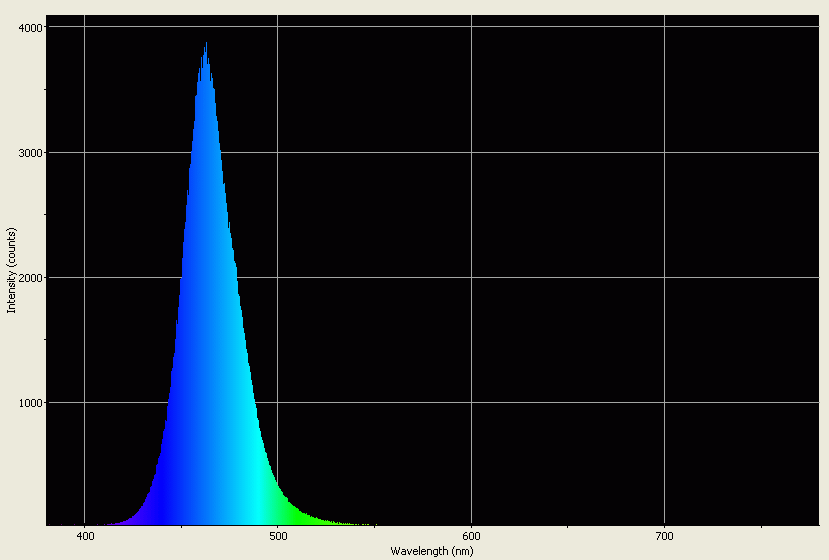
Spectrographic analysis of sample 2 of this LED.
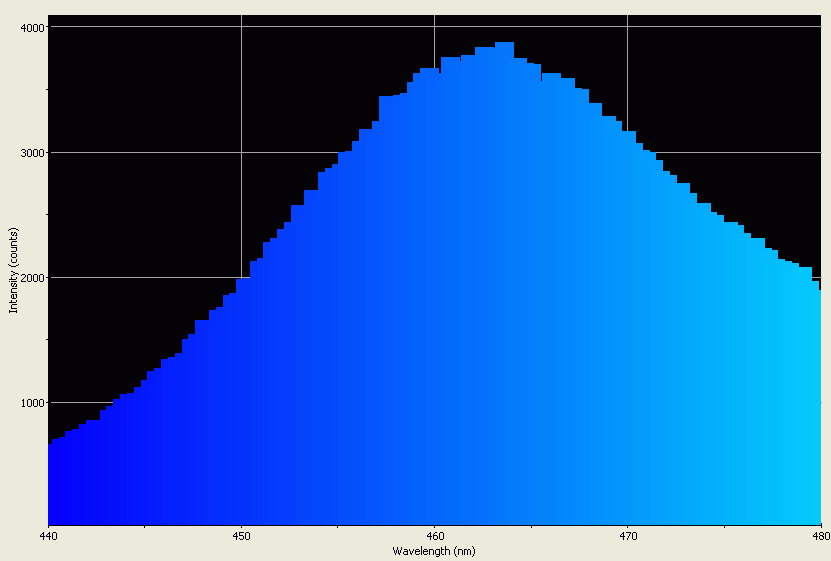
Spectrographic analysis of sample 2 of this LED; spectrometer's response narrowed to a band between 440nm and 480nm to pinpoint peak wavelength, which is 464.002nm.
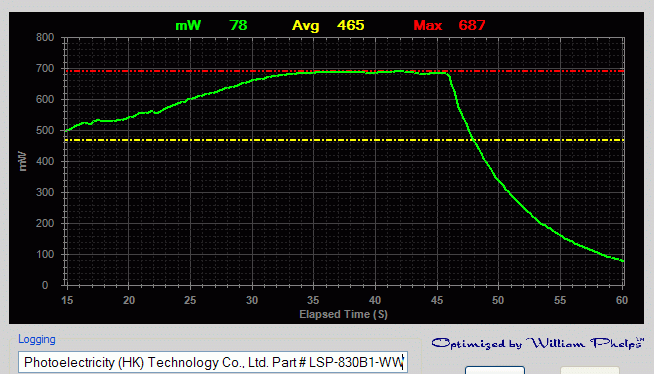
Power output analysis of sample 1 of this LED.
Tops out at 687mW.
The chart starts to fall off not because the LED became a DED (Dark-Emitting Diode), but because I pressed the wrong key on the keyboard when I attempted to perform a screen dump and then neutralised the power supply because I do not have a heatsink for the LED.
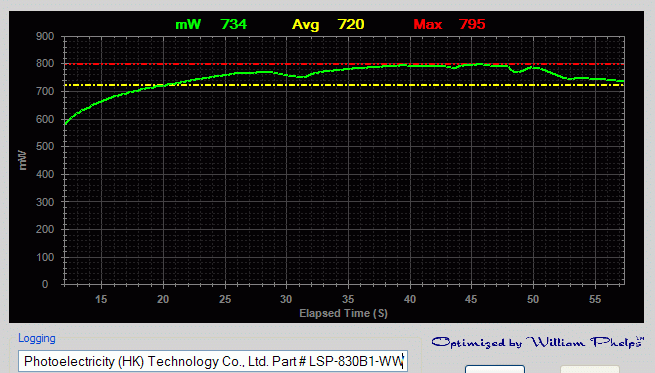
Power output analysis of sample 2 of this LED.
Tops out at 795mW.
Luckysunny Photoelectricity (HK) Technology Co., Ltd.
Part # LSP-830R1-WW (2)
Received 07-27-12, tested 08-08-12
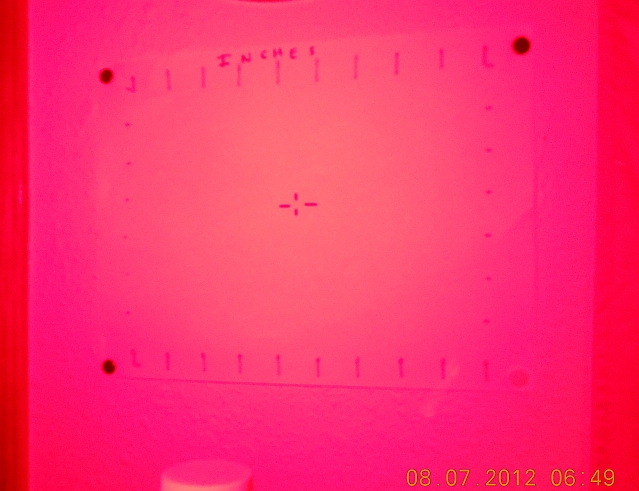
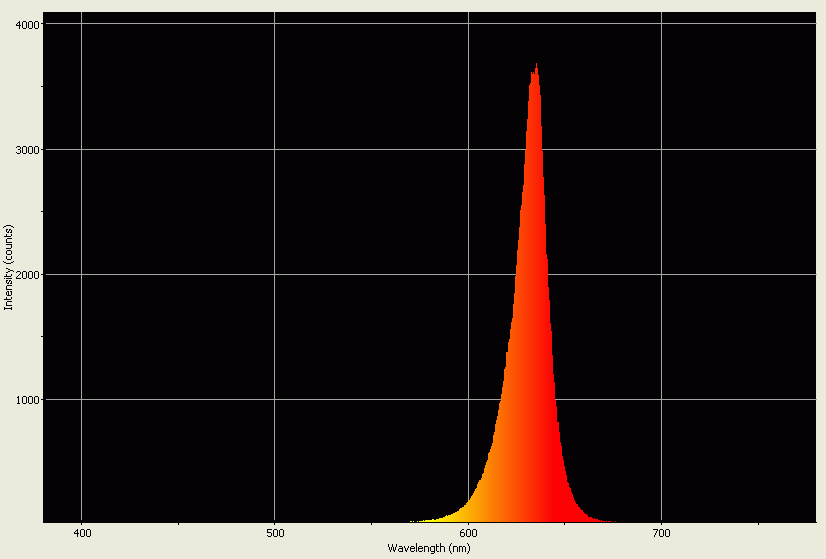
Spectrographic analysis of sample 1 of this LED.
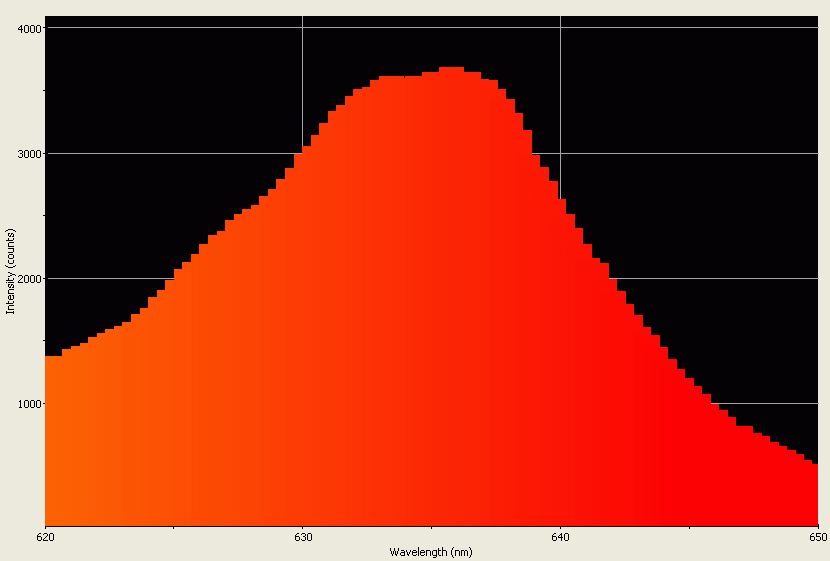
Spectrographic analysis of sample 1 of this LED; spectrometer's response narrowed to a band between 620nm and 650nm to pinpoint peak wavelength, which is 635.088nm.
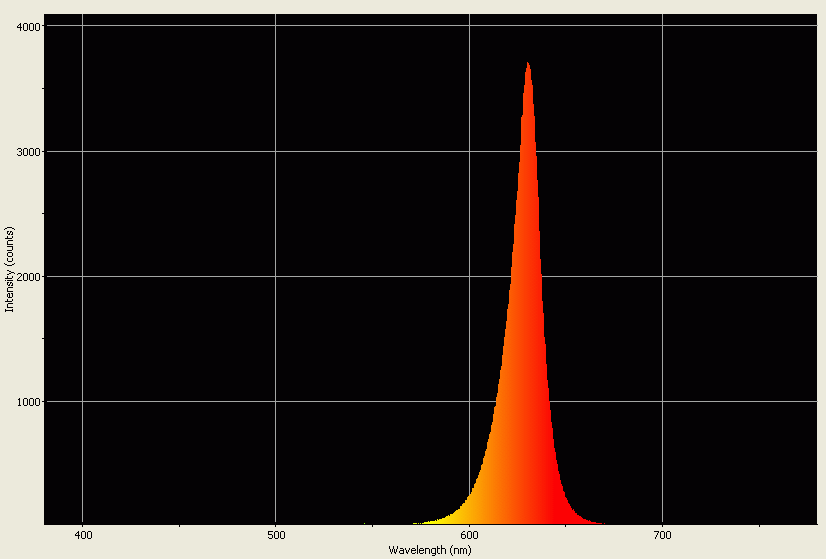
Spectrographic analysis of sample 2 of this LED.
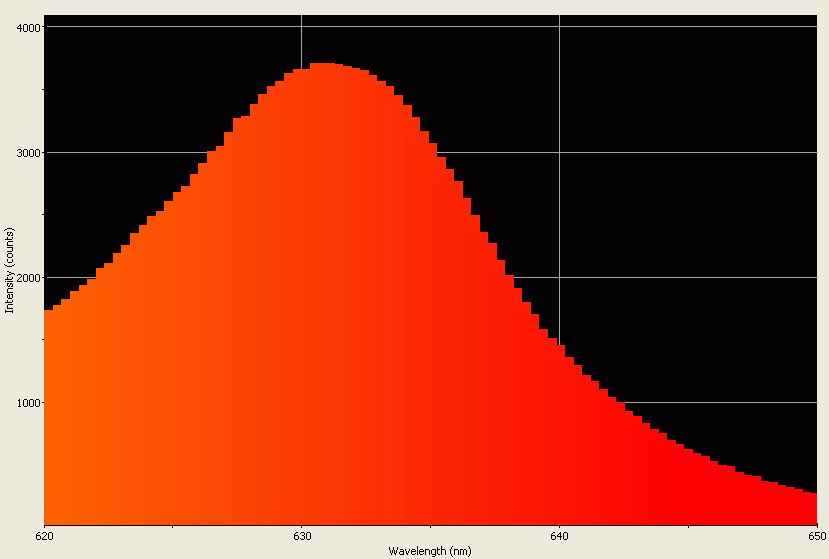
Spectrographic analysis of sample 2 of this LED; spectrometer's response narrowed to a band between 620nm and 650nm to pinpoint peak wavelength, which is 630.073nm.
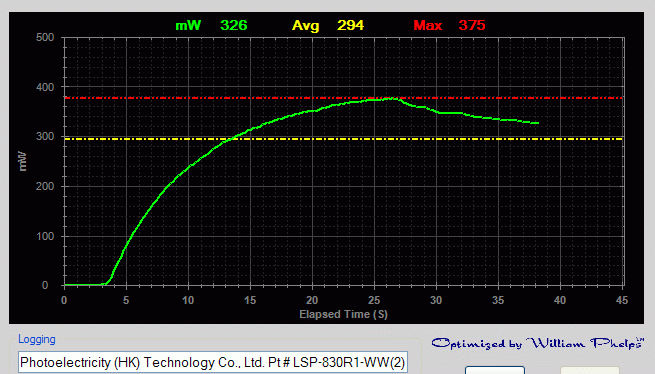
Power output analysis of sample 1 of this LED.
Tops out at 375mW.
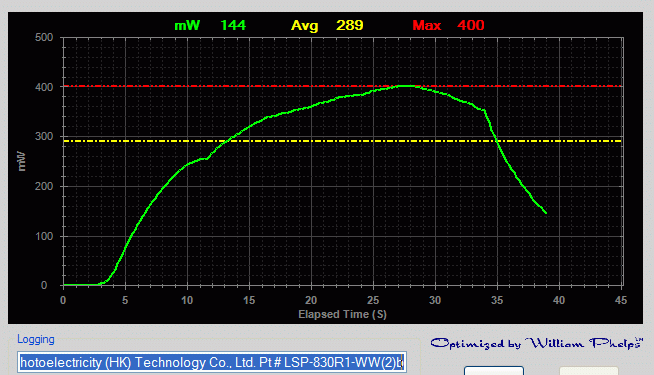
Power output analysis of sample 2 of this LED.
Tops out at 400mW.
Luckysunny Photoelectricity (HK) Technology Co., Ltd.
Part # LSP-830R1-WW
Received 07-27-12, tested 08-07-12
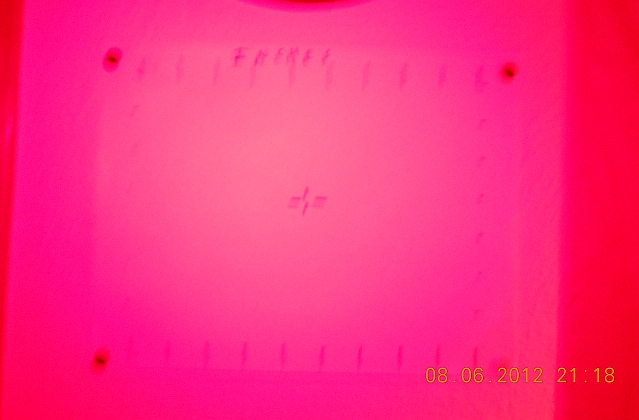
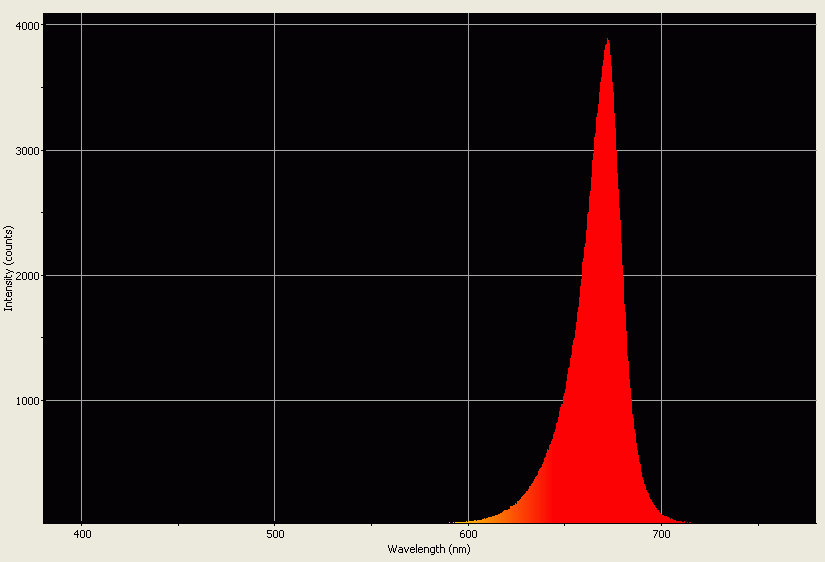
Spectrographic analysis of sample 1 of this LED.
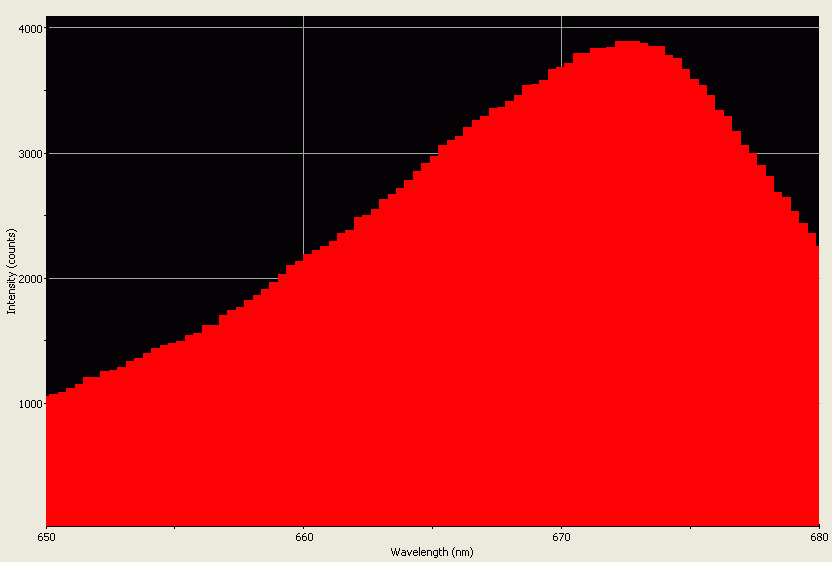
Spectrographic analysis of sample 1 of this LED; spectrometer's response narrowed to a band between 640nm and 680nm to pinpoint peak wavelength, which is 671.966nm.
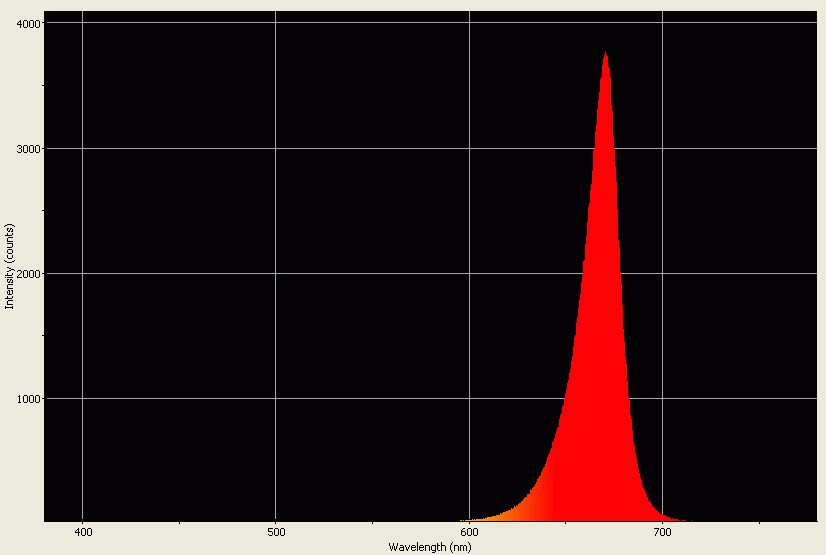
Spectrographic analysis of sample 2 of this LED.
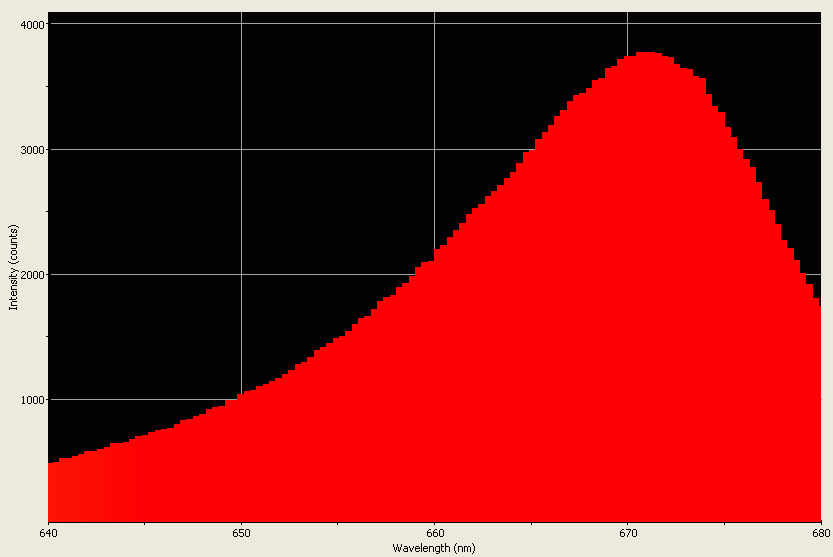
Spectrographic analysis of sample 2 of this LED; spectrometer's response narrowed to a band between 640nm and 680nm to pinpoint peak wavelength, which is 670.063nm.
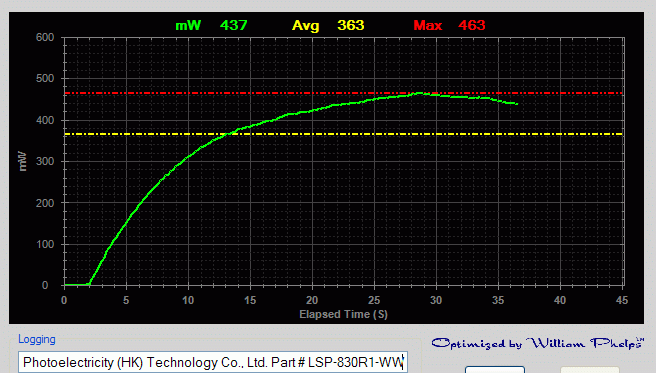
Power output analysis of sample 1 of this LED.
Tops out at 463mW.
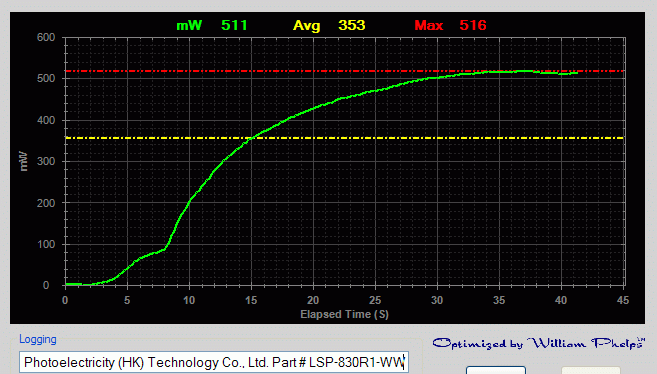
Power output analysis of sample 2 of this LED.
Tops out at 516mW.
T-Tec China (HK) Limited
Part # XL001-WP02UBGC
Received 07-27-12, tested 08-05-12
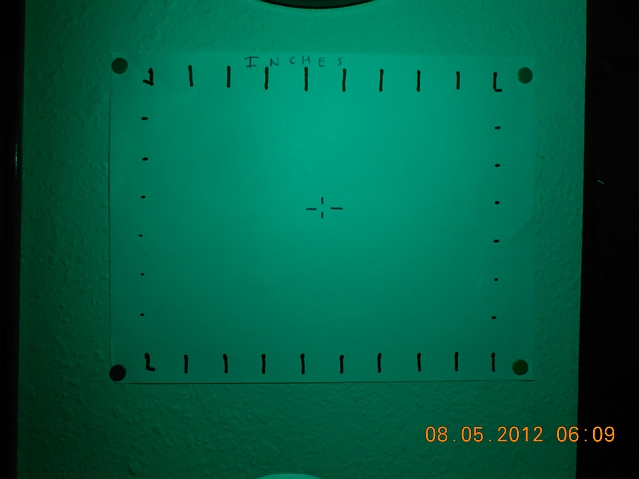
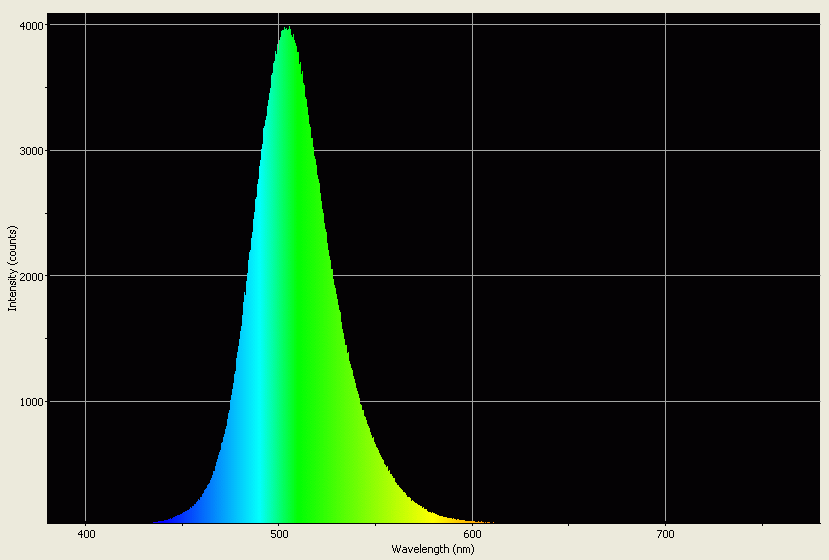
Spectrographic analysis of sample 1 of this LED.
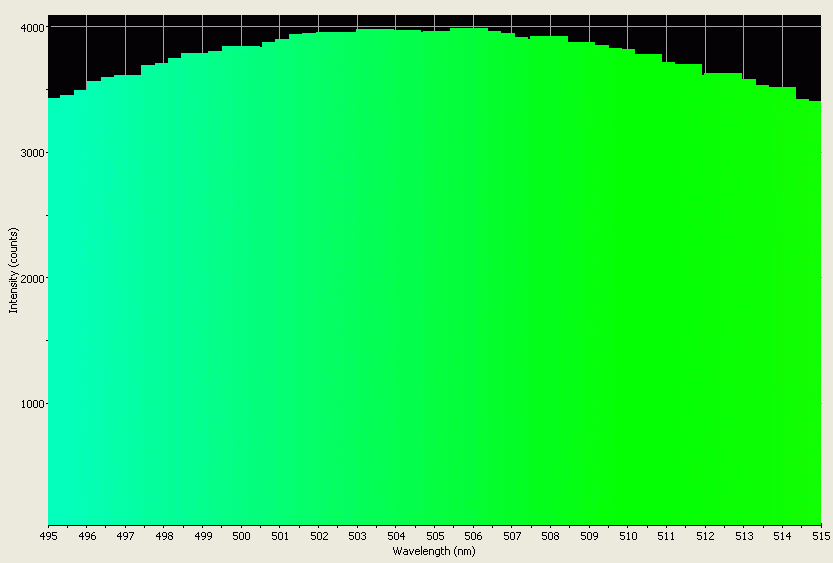
Spectrographic analysis of sample 1 of this LED; spectrometer's response narrowed to a band between 495nm and 515nm to pinpoint peak wavelength, which is 505.488nm.
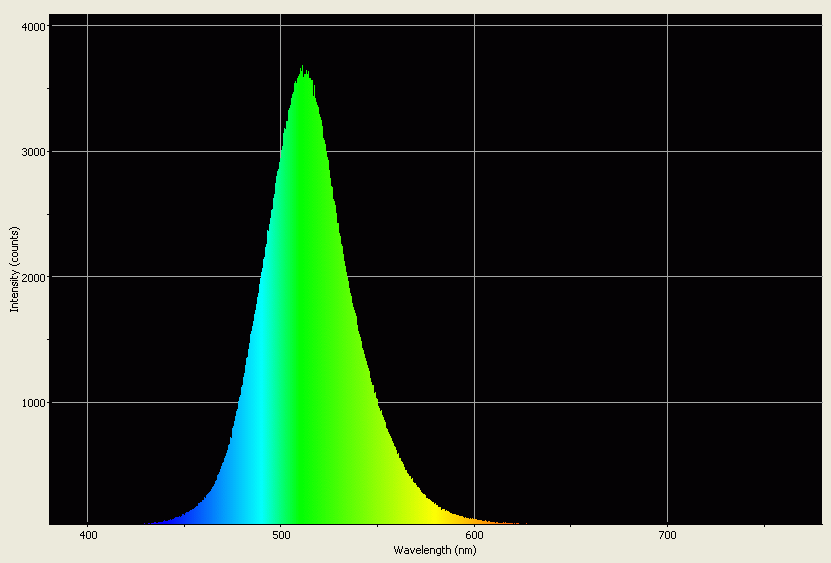
Spectrographic analysis of sample 2 of this LED.
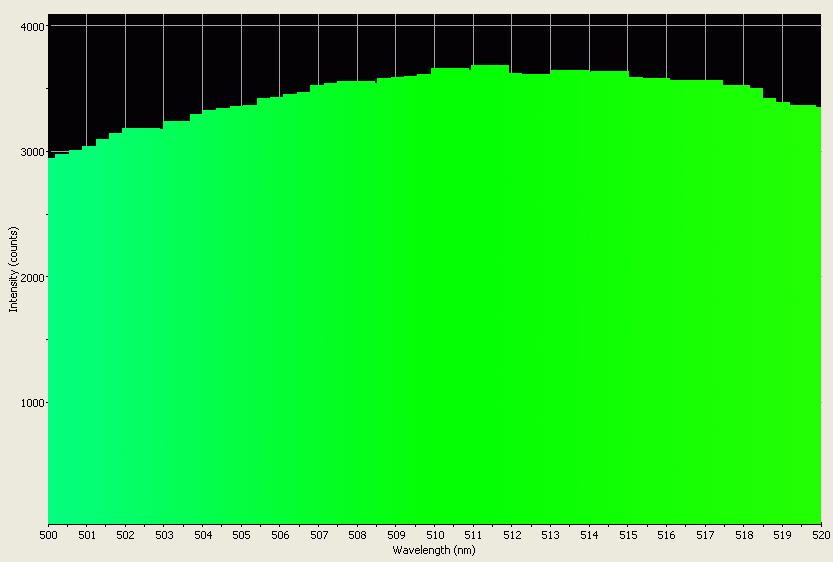
Spectrographic analysis of sample 2 of this LED; spectrometer's response narrowed to a band between 500nm and 520nm to pinpoint peak wavelength, which is 510.991nm.
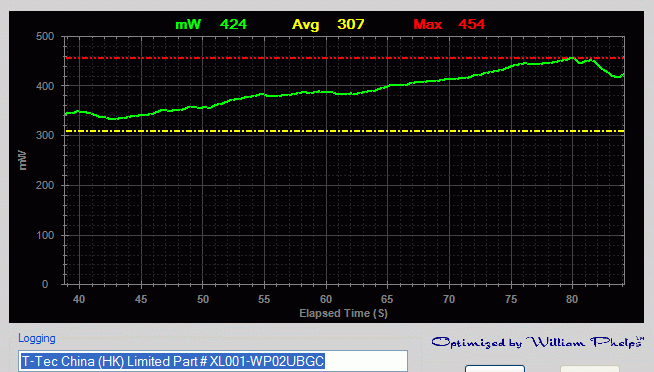
Power output analysis of sample 1 of this LED.
Tops out at 454mW.
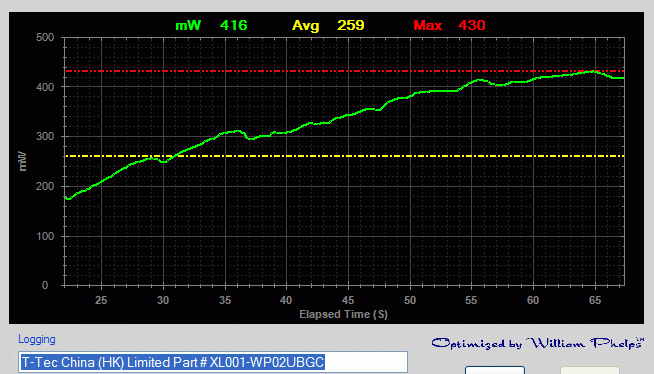
Power output analysis of sample 2 of this LED.
Tops out at 330mW.
Luckysunny Photoelectricity (HK) Technology Co., Ltd.
Part # LSP-830Y1-WW
Received 07-27-12, tested 08-01-12
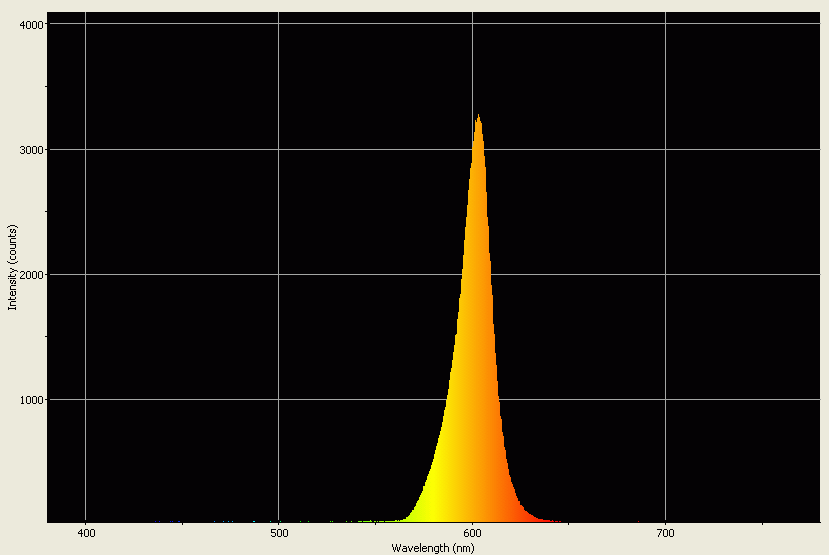
Spectrographic analysis of sample 1 of this LED.
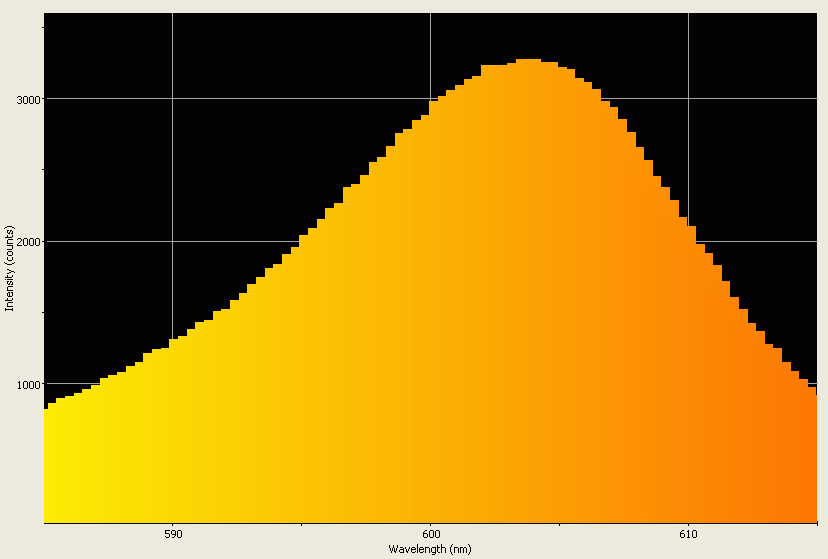
Spectrographic analysis of sample 1 of this LED; spectrometer's response narrowed to a band between 585nm and 615nm to pinpoint peak wavelength, which is 603.299nm.
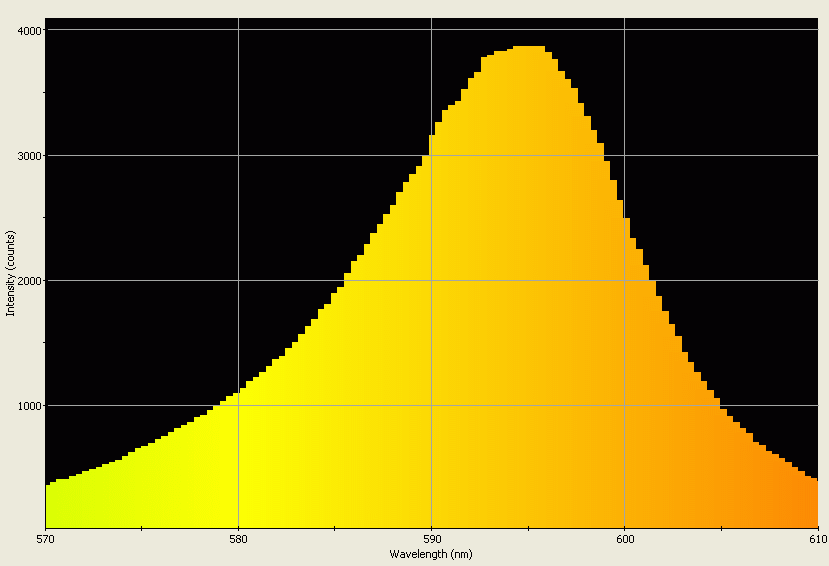
Spectrographic analysis of sample 1 of this LED; If= reduced to 142.30mA to help stem wavelength shift. Spectrometer's response narrowed to a band between 570nm and 610nm to pinpoint peak wavelength, which is 594.244nm.
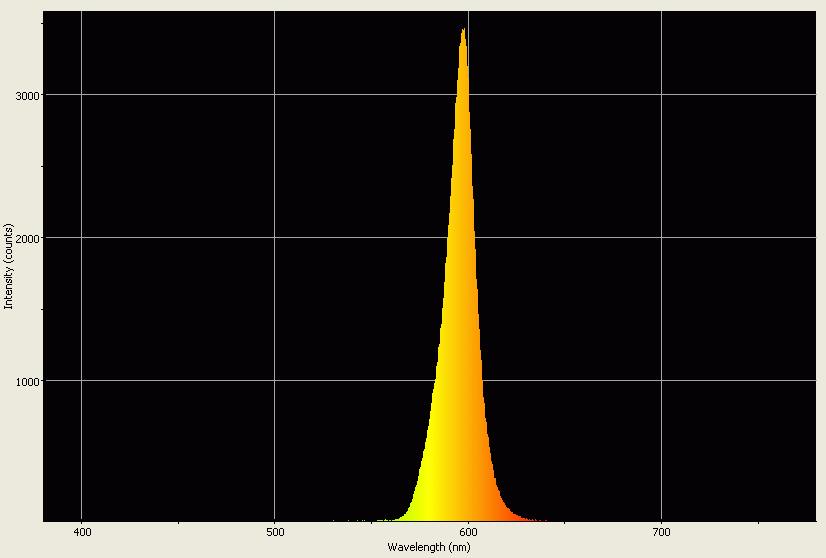
Spectrographic analysis of sample 2 of this LED.
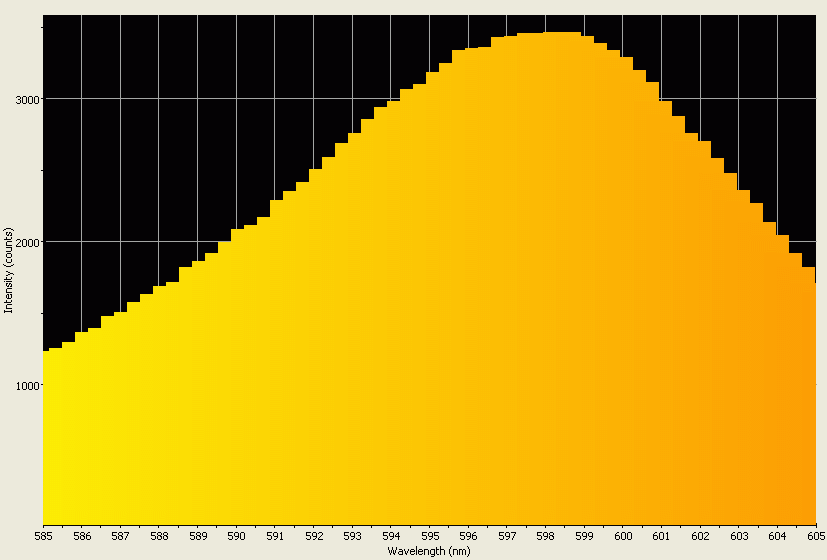
Spectrographic analysis of sample 2 of this LED; spectrometer's response narrowed to a band between 585nm and 605nm to pinpoint peak wavelength, which is 597.948nm.
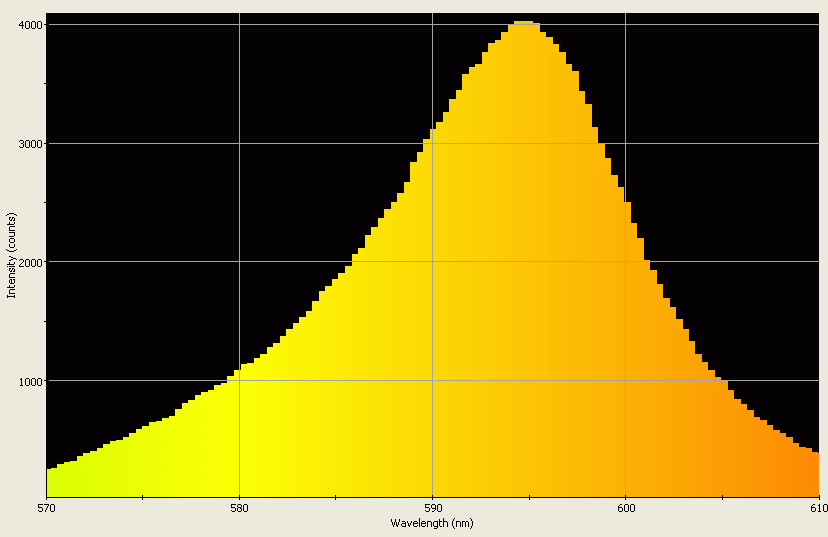
Spectrographic analysis of sample 2 of this LED; If= reduced to 142.30mA to help stem wavelength shift. Spectrometer's response narrowed to a band between 570nm and 610nm to pinpoint peak wavelength, which is 594.236nm.
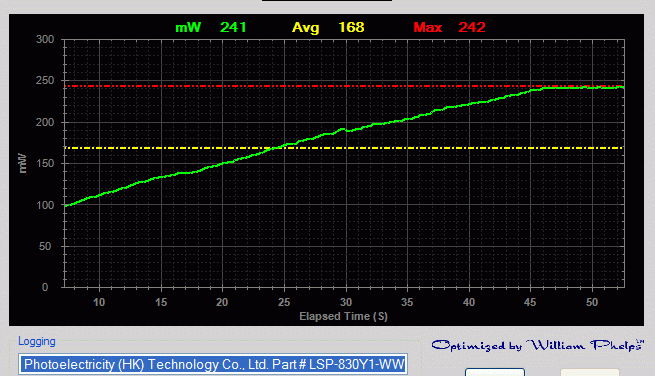
Power output analysis of sample 1 of this LED.
Tops out at 242mW.
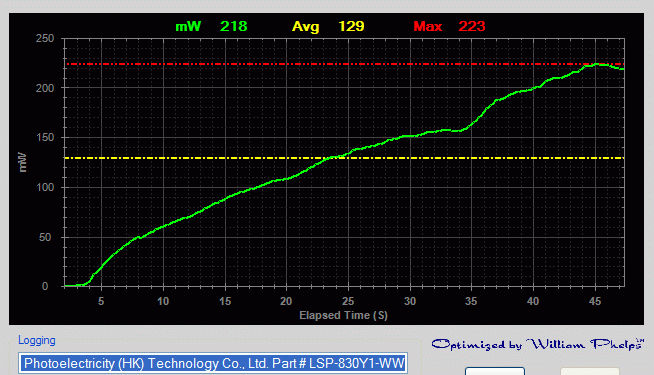
Power output analysis of sample 2 of this LED.
Tops out at 223mW.
HARVATEK Part # HT-1W-V
Received 07-27-12, tested 07-29-12
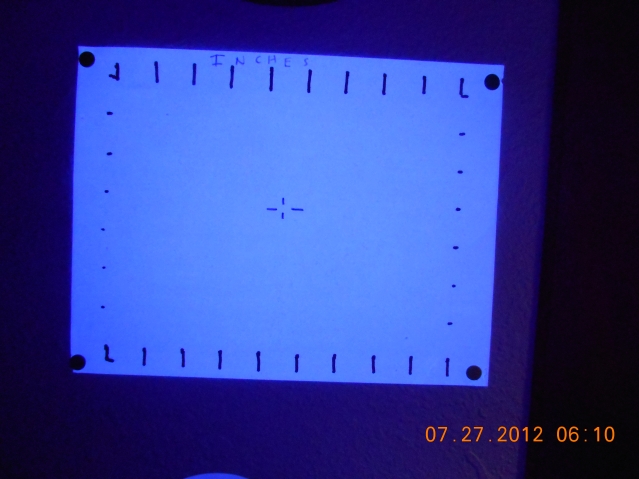
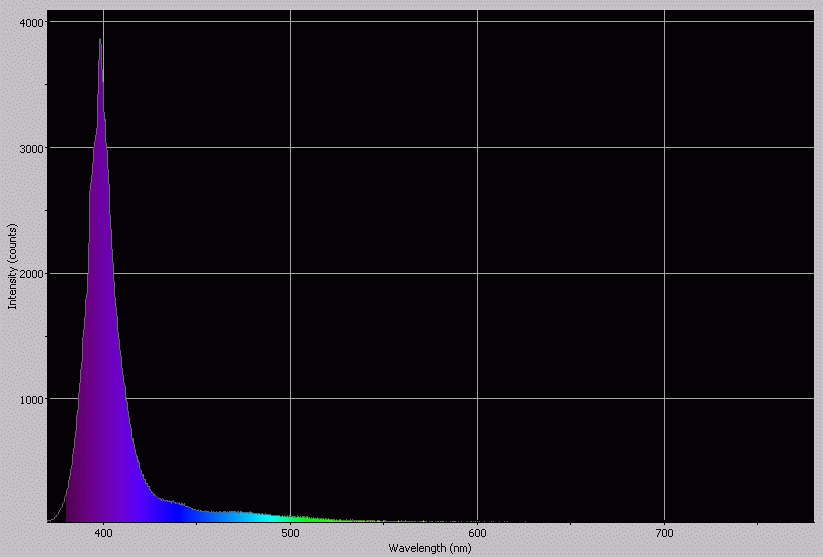
Spectrographic analysis of sample 1 of this LED.
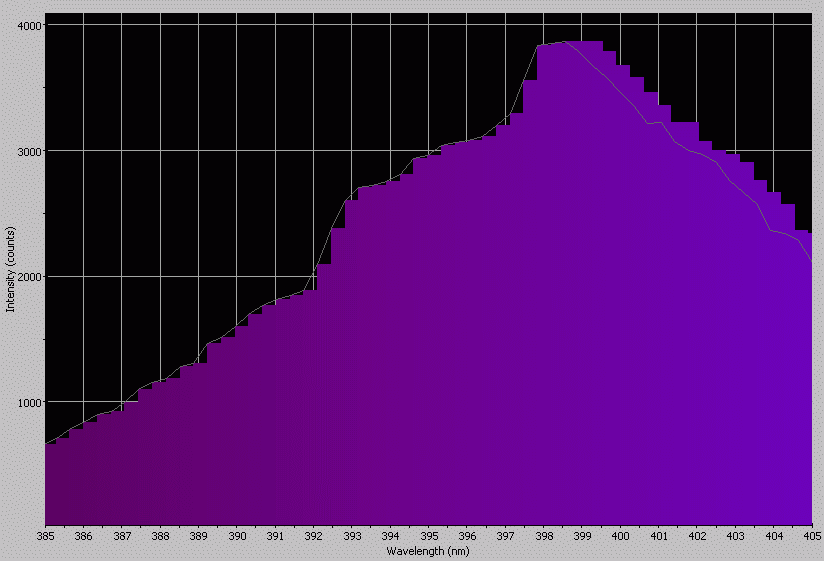
Spectrographic analysis of sample 1 of this LED; spectrometer's response narrowed to a band between 385nm and 405nm to pinpoint peak wavelength, which is 398.522nm.
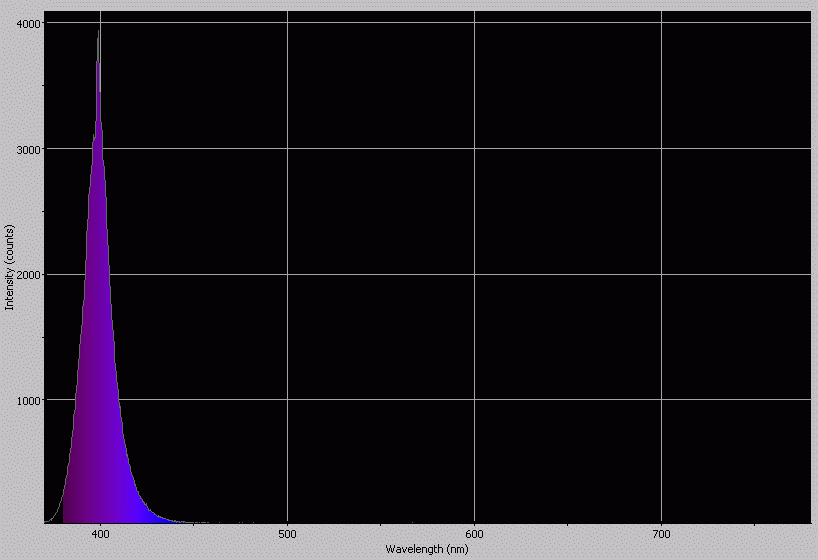
Spectrographic analysis of sample 2 of this LED.
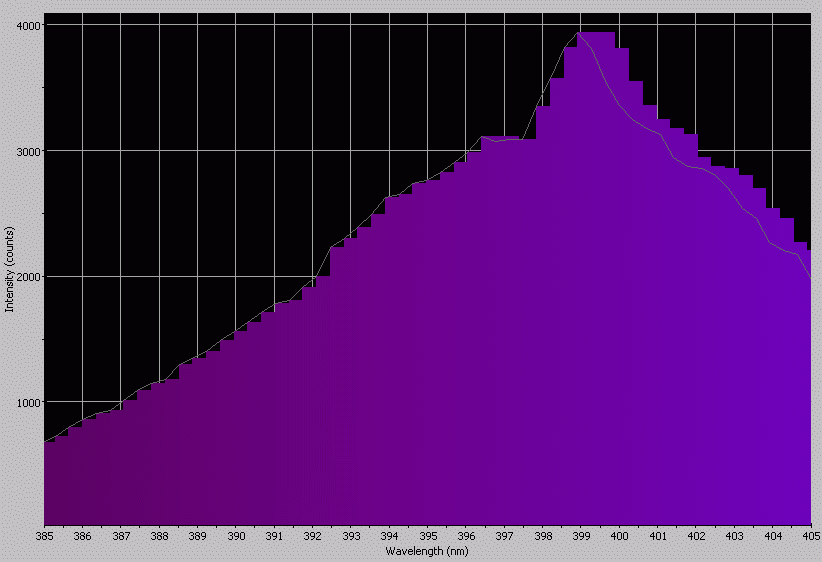
Spectrographic analysis of sample 2 of this LED; spectrometer's response narrowed to a band between 385nm and 405nm to pinpoint peak wavelength, which is 398.947nm.
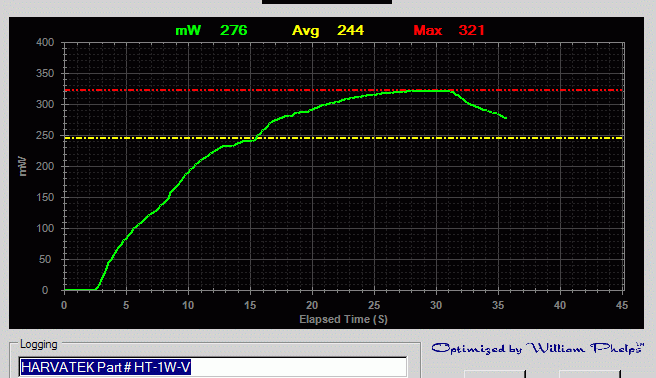
Power output analysis of sample 1 of this LED.
Tops out at 321mW.
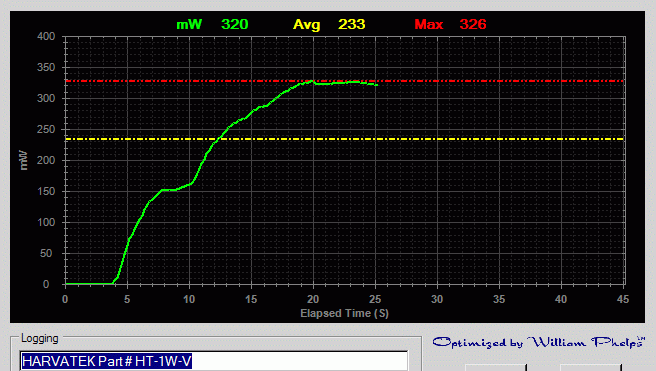
Power output analysis of sample 2 of this LED.
Tops out at 326mW.
Luckysunny Photoelectricity (HK) Technology Co., Ltd.
Part # LSP-830UV1-WW
Received 07-27-12, tested 07-28-12
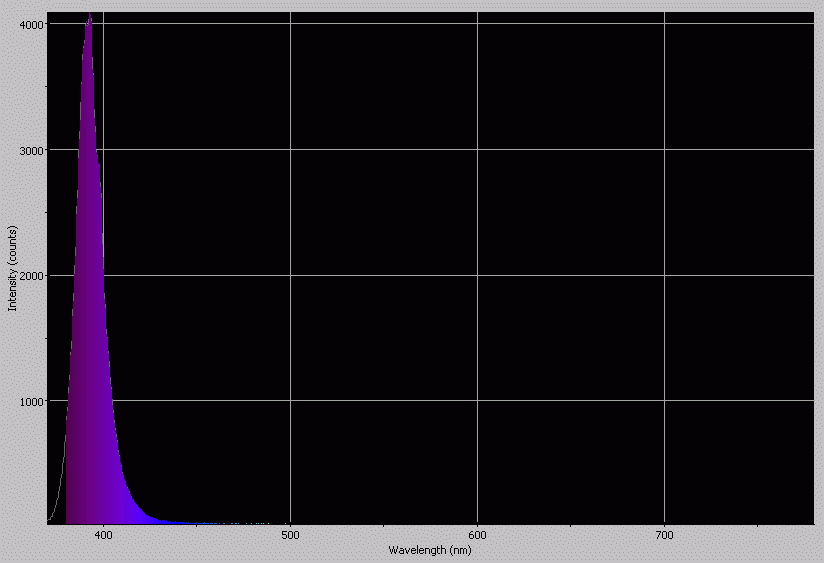
Spectrographic analysis of sample 1 of this LED.
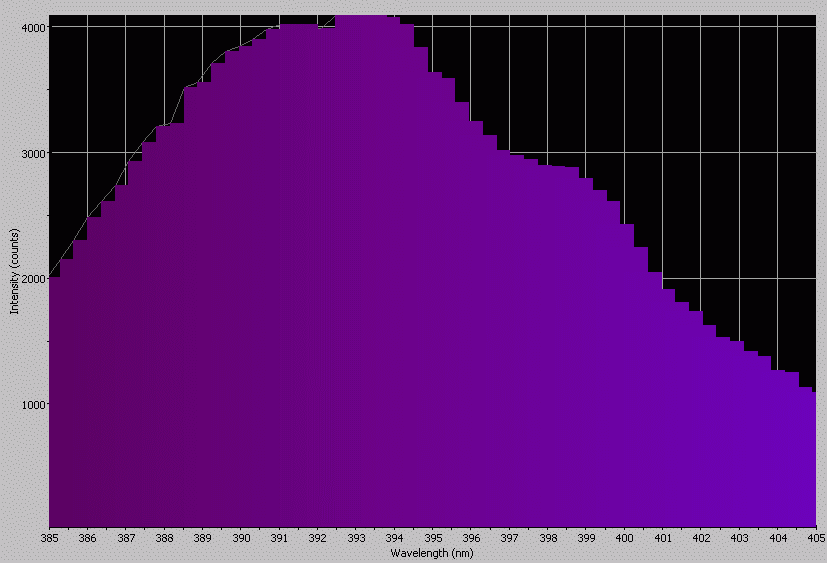
Spectrographic analysis of sample 1 of this LED; spectrometer's response narrowed to a band between 385nm and 405nm to pinpoint peak wavelength, which is 392.497nm.
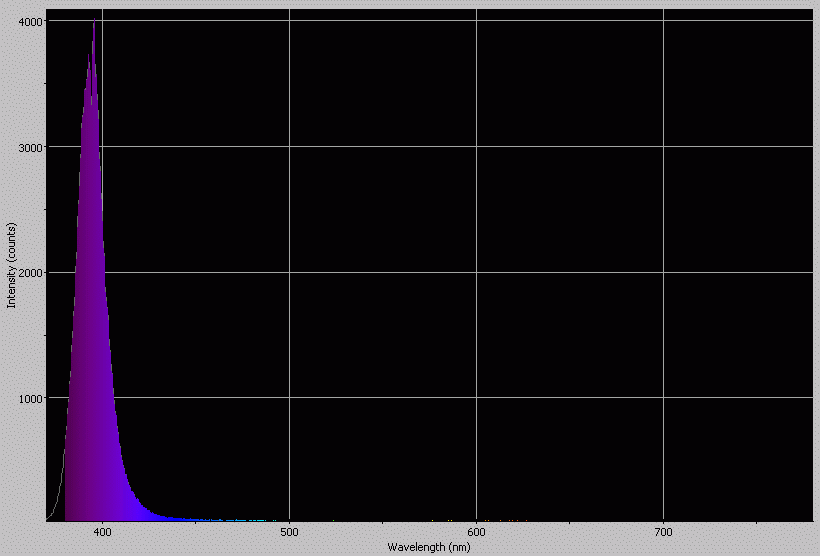
Spectrographic analysis of sample 2 of this LED.
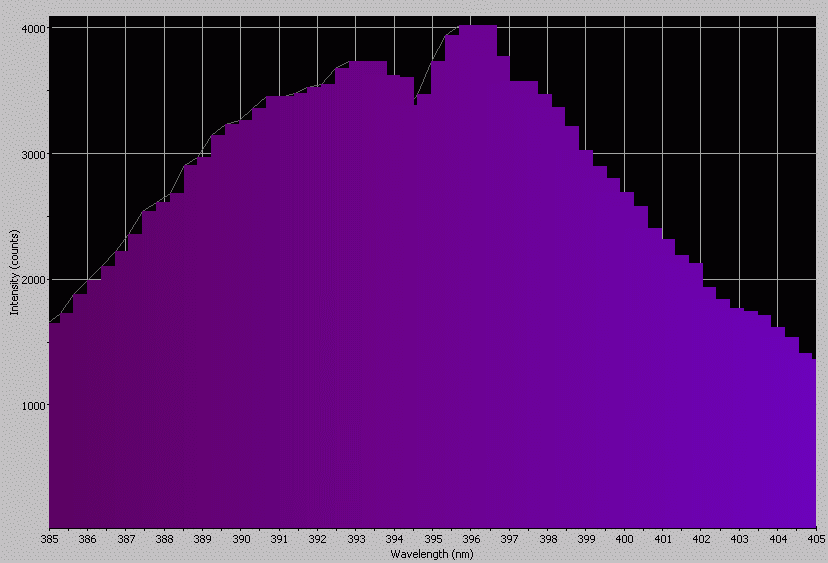
Spectrographic analysis of sample 2 of this LED; spectrometer's response narrowed to a band between 385nm and 405nm to pinpoint peak wavelength, which is 395.622nm.
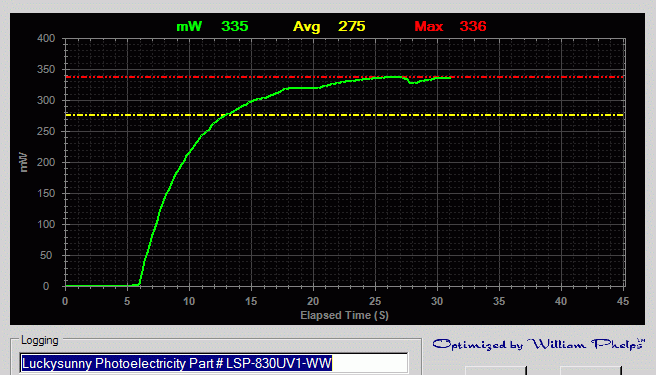
Power output analysis of sample 1 of this LED.
Tops out at 336mW.
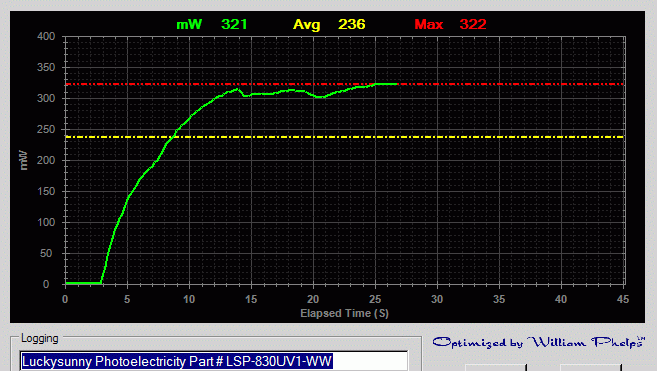
Power output analysis of sample 2 of this LED.
Tops out at 322mW.
