Filtered Light Sources
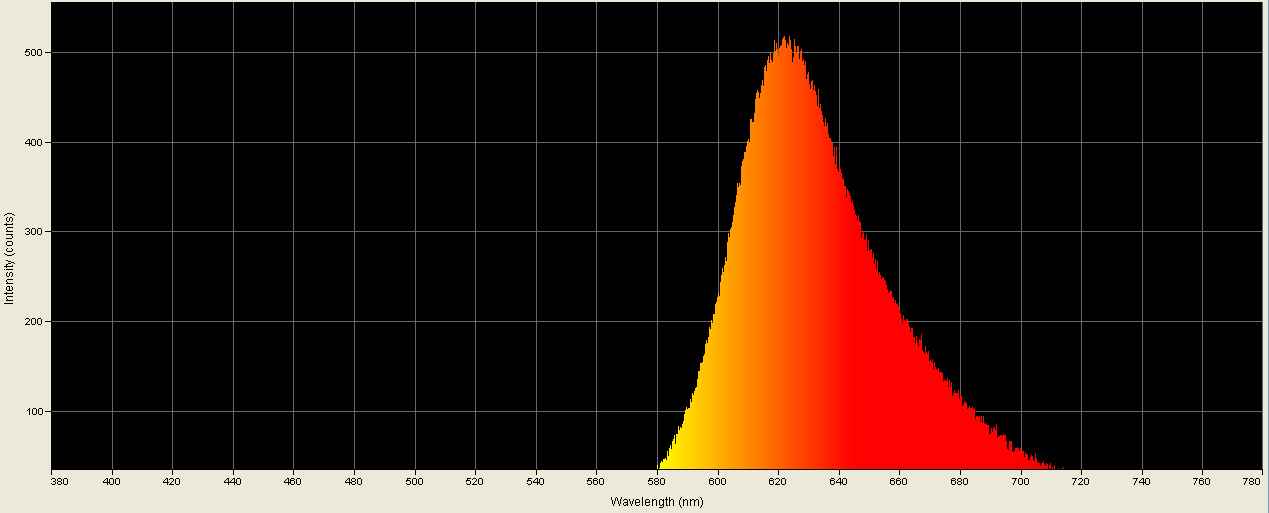
Spectrographic analysis of the LED (red filter) in the LED Christmas Light Bulb Headband.
The raw spectrometer data (tab-delimited that can be loaded into Excel) is at xhr.txt
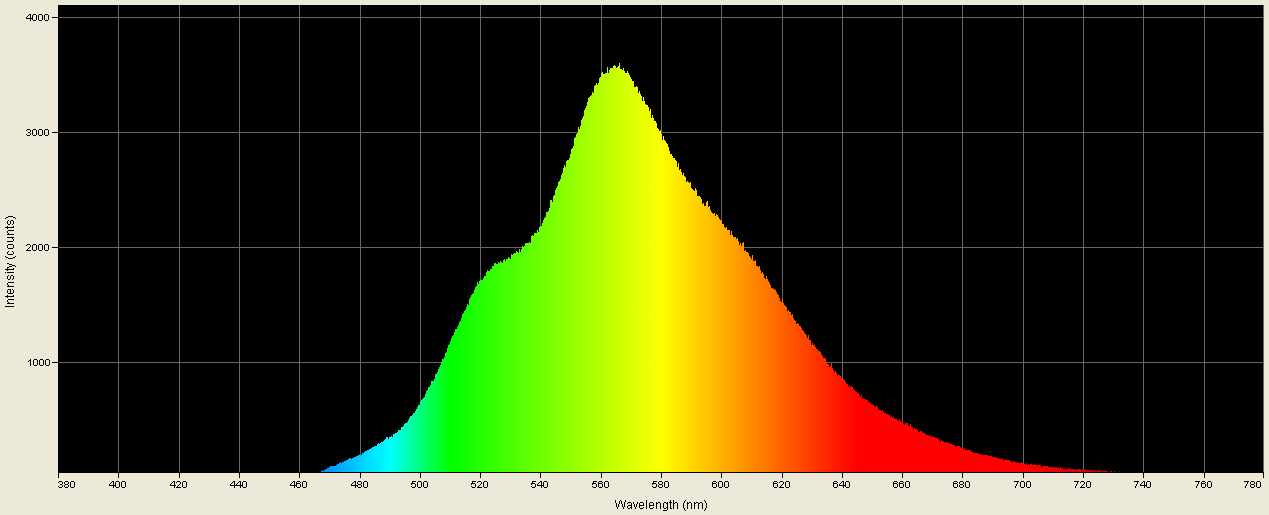
Spectrographic analysis of the LED (yellow filter) in the LED Christmas Light Bulb Headband.
The raw spectrometer data (tab-delimited that can be loaded into Excel) is at xhy.txt
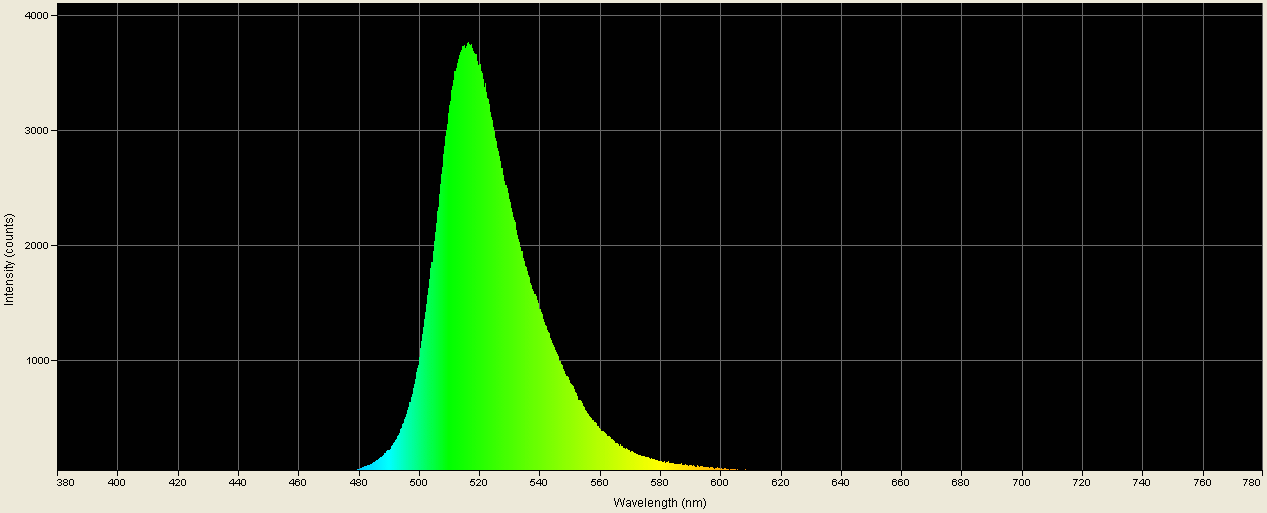
Spectrographic analysis of the LED (green filter) in the LED Christmas Light Bulb Headband.
The raw spectrometer data (tab-delimited that can be loaded into Excel) is at xhg.txt
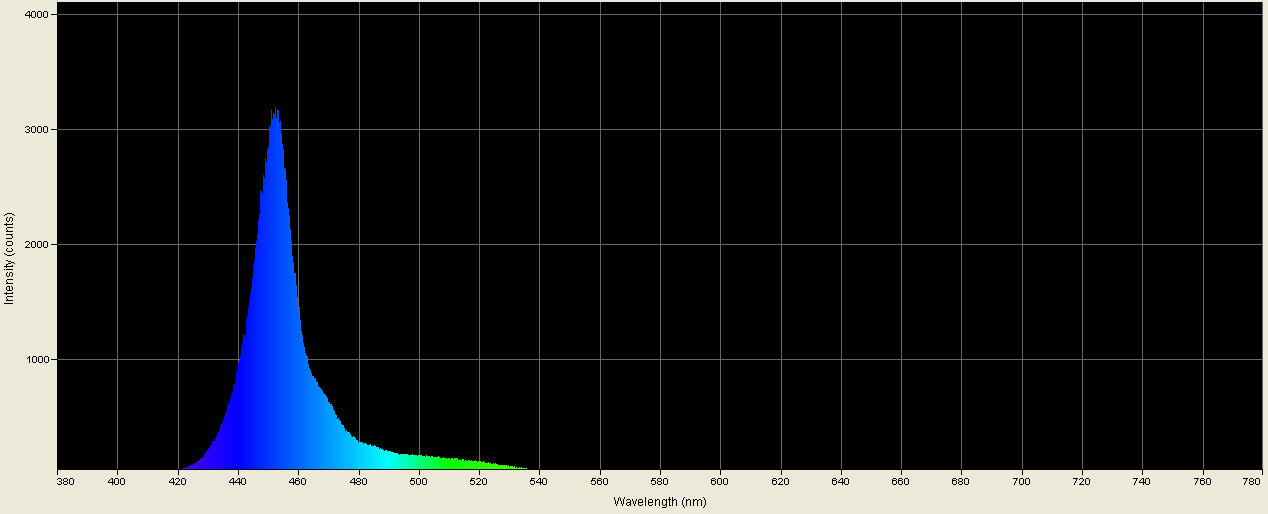
Spectrographic analysis of the LED (blue filter) in the LED Christmas Light Bulb Headband.
The raw spectrometer data (tab-delimited that can be loaded into Excel) is at xhb.txt
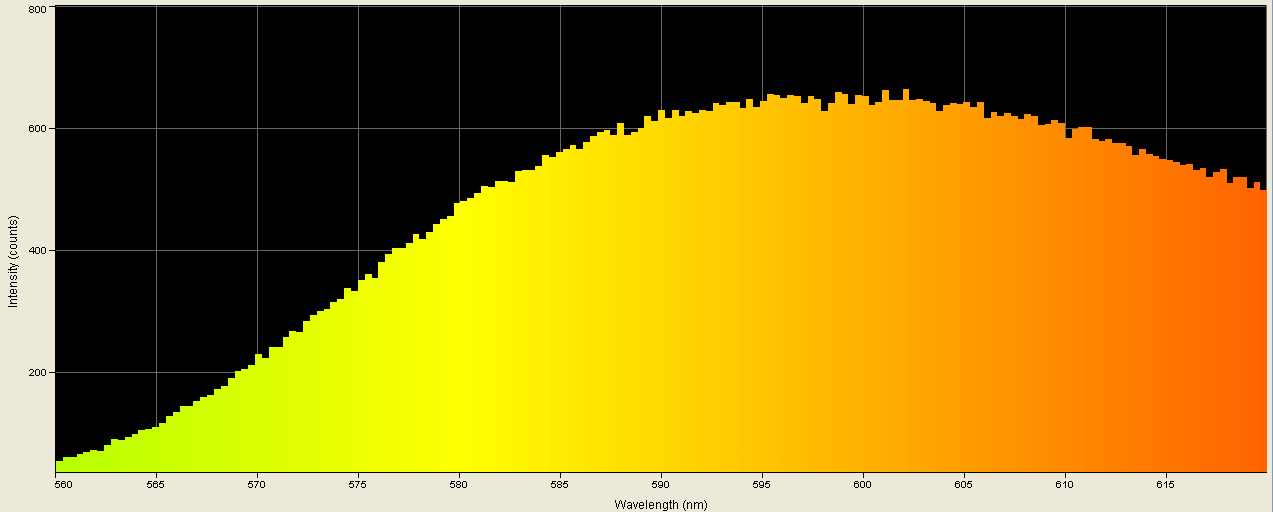
Spectrographic analysis of one of the filtered (red) LEDs in the Jumbo Light-Up Necklace; spectrometer's response narrowed to a band between 560nm and 620nm to pinpoint dye transmission peak, which is 601.980nm.
The raw spectrometer data (tab-delimited that can be loaded into Excel) is at xneck-r.txt
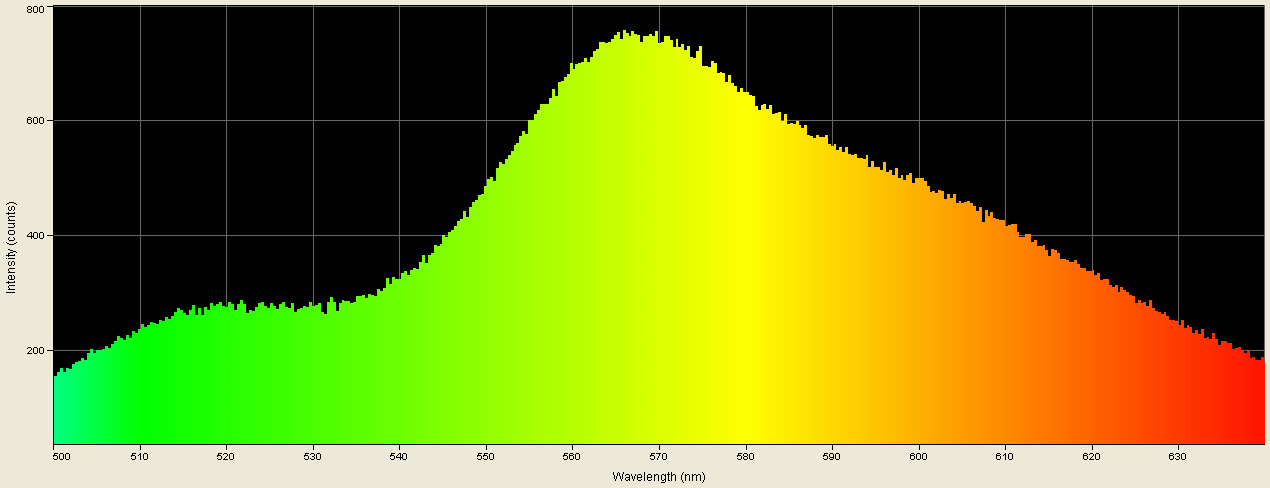
Spectrographic analysis of one of the filtered (yellow) LEDs in the Jumbo Light-Up Necklace; spectrometer's response narrowed to a band between 500nm and 640nm to pinpoint dye transmission peak, which is 565.860nm.
The raw spectrometer data (tab-delimited that can be loaded into Excel) is at xneck-y.txt
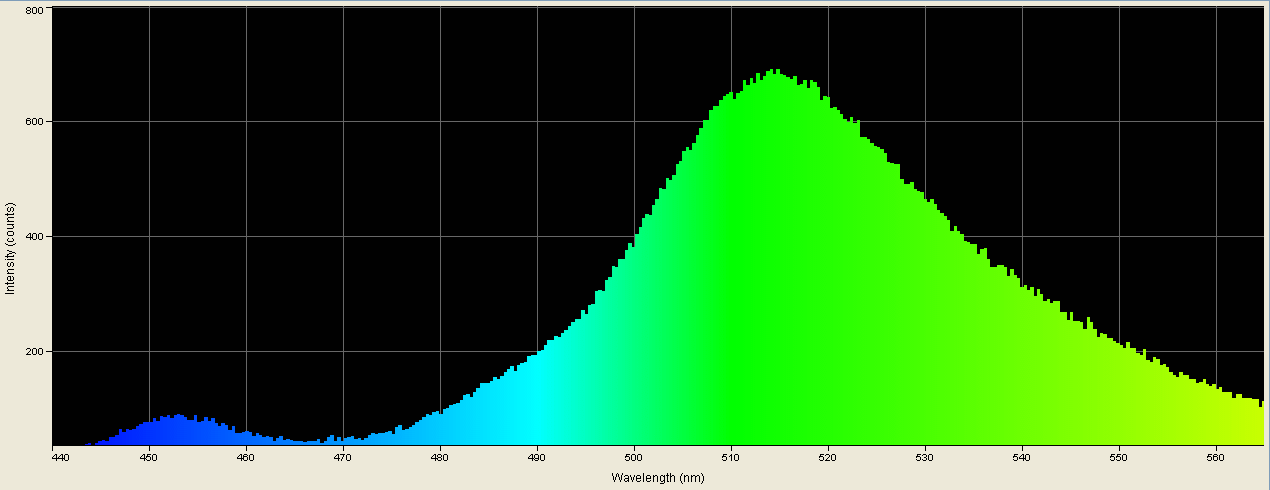
Spectrographic analysis of one of the filtered (green) LEDs in the Jumbo Light-Up Necklace; spectrometer's response narrowed to a band between 440nm and 565nm to pinpoint dye transmission peak, which is 514.760nm.
The raw spectrometer data (tab-delimited that can be loaded into Excel) is at xneck-g.txt
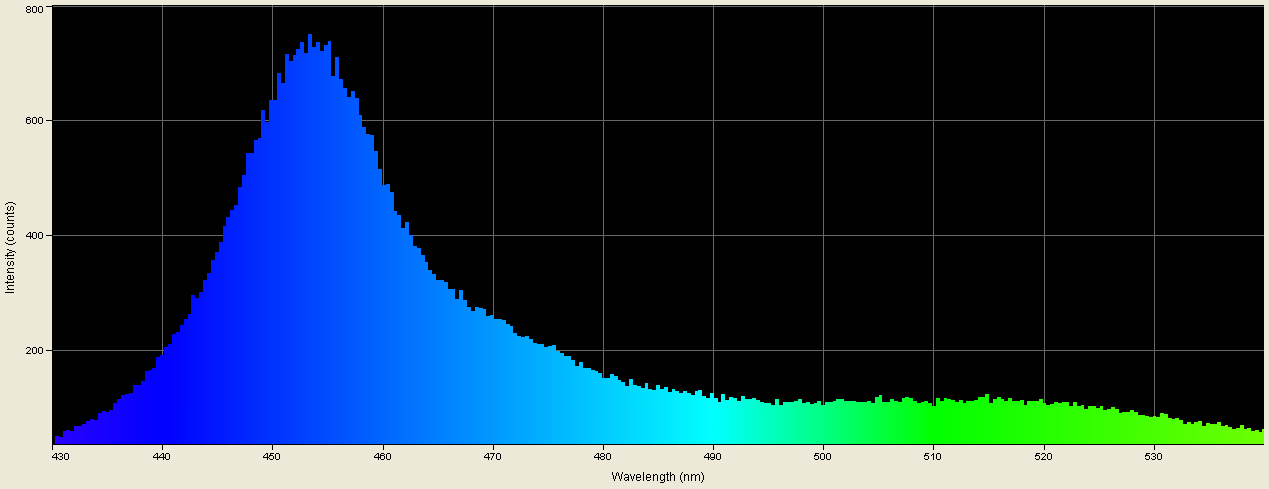
Spectrographic analysis of one of the filtered (blue) LEDs in the Jumbo Light-Up Necklace; spectrometer's response narrowed to a band between 430nm and 540nm to pinpoint dye transmission peak, which is 453.290nm.
The raw spectrometer data (tab-delimited that can be loaded into Excel) is at xneck-b.txt
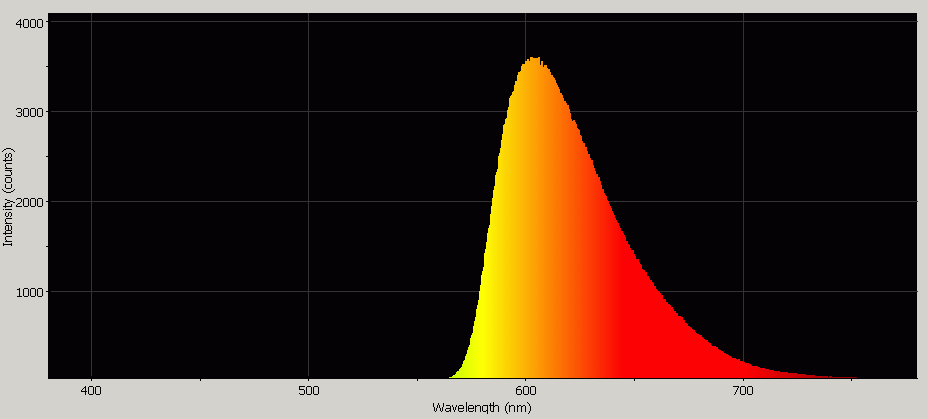
Spectrographic analysis of the LEDs in the Beam N Read® LED 3 Hands-Free Travel & Reading Light with USB/AC Power Kit (red filter).
Spectrographic analysis of the LEDs in the Beam N Read® LED 3 Hands-Free Travel & Reading Light with USB/AC Power Kit (red filter); spectrometer's response narrowed to a band between 420nm and 450nm to pinpoint native emission peak wavelength, which was undetectable.
The raw spectrometer data (comma-delimited that can be loaded into Excel) is at /47/bnr3-2-r.txt
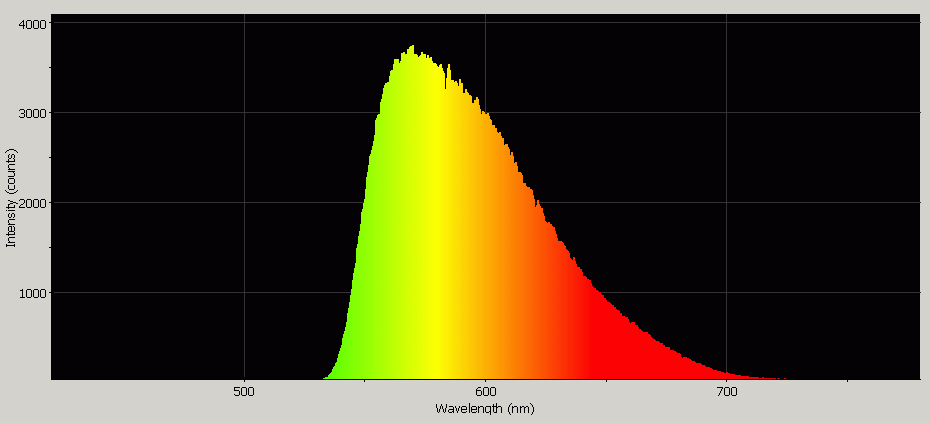
Spectrographic analysis of the LEDs in the Beam N Read® LED 3 Hands-Free Travel & Reading Light with USB/AC Power Kit (orange filter).
Spectrographic analysis of the LEDs in the Beam N Read® LED 3 Hands-Free Travel & Reading Light with USB/AC Power Kit (orange filter); spectrometer's response narrowed to a band between 420nm and 450nm to pinpoint native emission peak wavelength, which was undetectable.
The raw spectrometer data (comma-delimited that can be loaded into Excel) is at /47/bnr3-2-o.txt
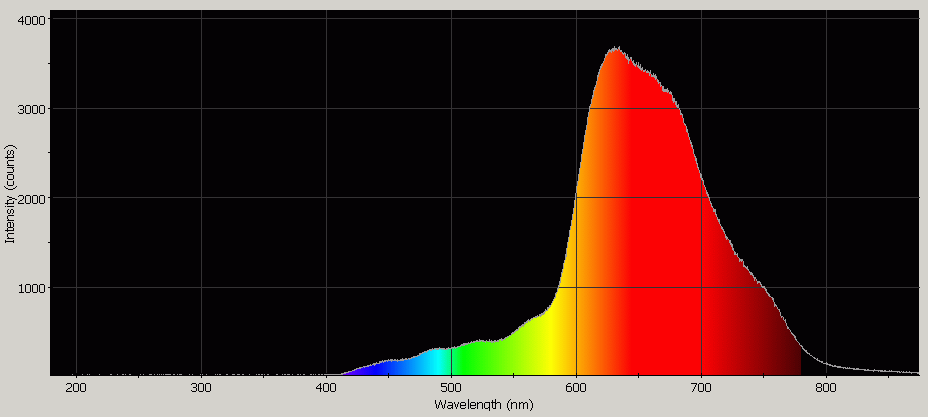
Spectrographic analysis of the red-tinted Ektron bulb in the Beam N Read® Classic.
The raw spectrometer data (comma-delimited that can be loaded into Excel) is at /46/bnrctr.txt

Spectrographic analysis of the red-tinted Ektron bulbs in the Beam N Read® Classic Twin.
The raw spectrometer data (comma-delimited that can be loaded into Excel) is at /46/bnrctr.txt
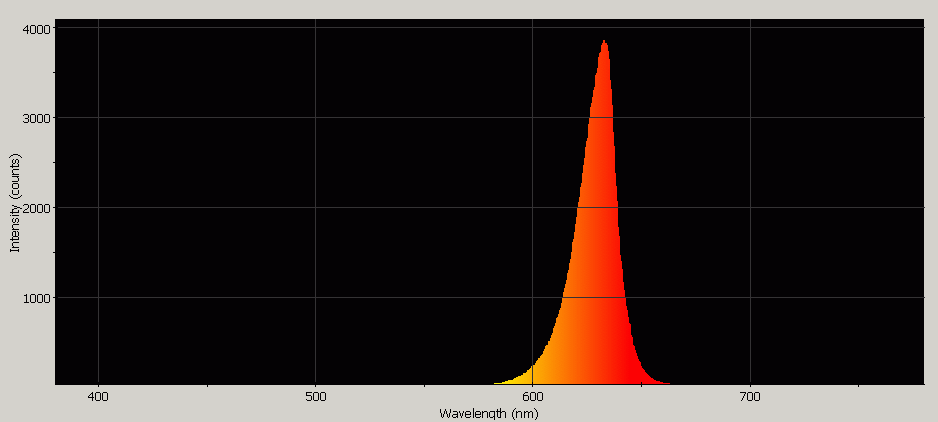
Spectrographic analysis of the LEDs in the Beam N Read® Pilot (red filter).
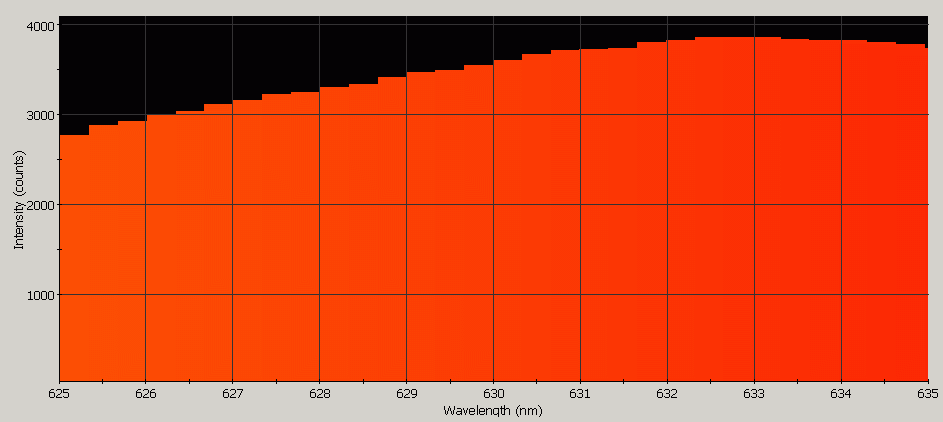
Spectrographic analysis of the LEDs in the Beam N Read® Pilot (red filter); spectrometer's response narrowed to a band between 625nm and 635nm to pinpoint emission peak wavelength, which is 632.320nm.
The raw spectrometer data (comma-delimited that can be loaded into Excel) is at /46/bnrprf.txt
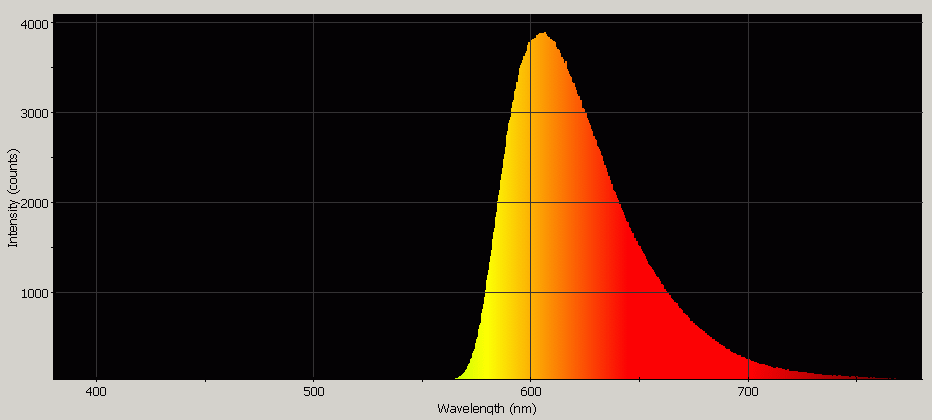
Spectrographic analysis of the LEDs in the Beam N Read® 3x LED Handsfree Travel Reading Light (red filter).
Spectrographic analysis of the LEDs in the Beam N Read® 3x LED Handsfree Travel Reading Light (red filter); spectrometer's response narrowed to a band between 420nm and 450nm to pinpoint native emission peak wavelength, which was undetectable.
The raw spectrometer data (comma-delimited that can be loaded into Excel) is at /46/bnr3-r.txt
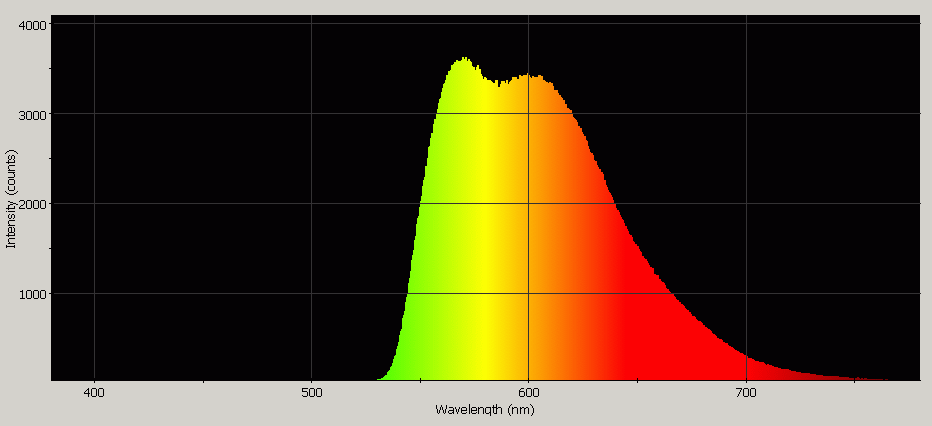
Spectrographic analysis of the LEDs in the Beam N Read® 6-LED Handsfree Deluxe Reading Light (orange filter).
Spectrographic analysis of the LEDs in the Beam N Read® 6-LED Handsfree Deluxe Reading Light (orange filter); spectrometer's response narrowed to a band between 380nm and 450nm to pinpoint native emission peak wavelength, which is not detectable -- the filter attenuates all of the blue radiation.
The raw spectrometer data (comma-delimited that can be loaded into Excel) is at /46/bnr6-o.txt
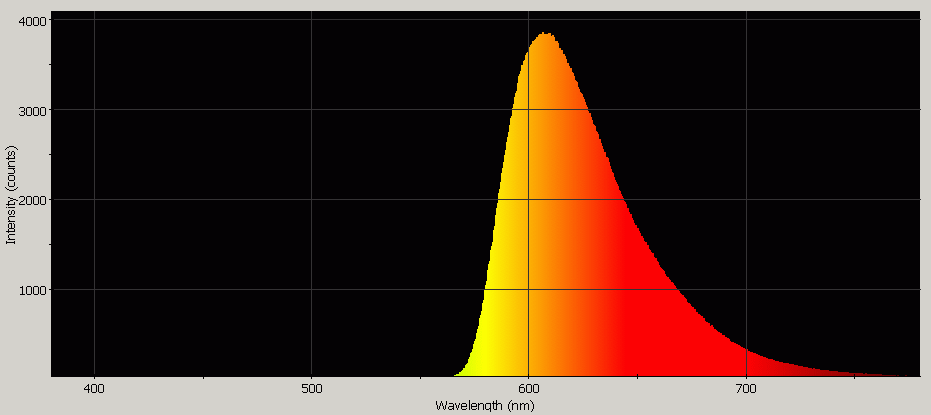
Spectrographic analysis of the LEDs in the Beam N Read® 6-LED Handsfree Deluxe Reading Light (red filter).
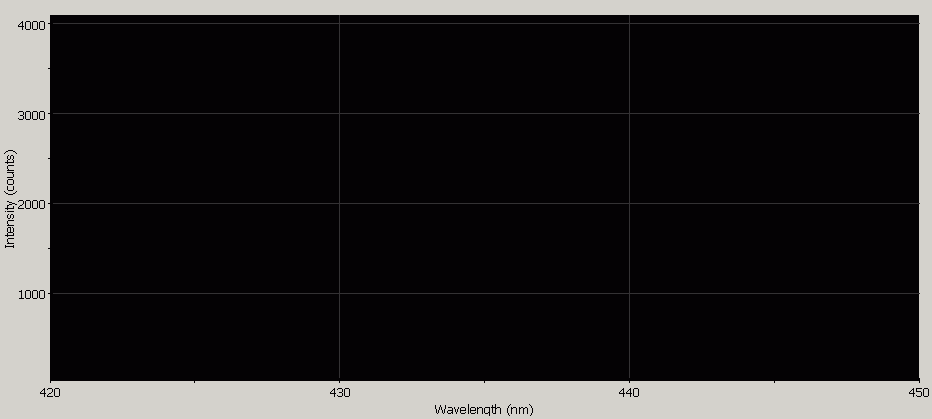
Spectrographic analysis of the LEDs in the Beam N Read® 6-LED Handsfree Deluxe Reading Light (red filter); spectrometer's response narrowed to a band between 420nm and 450nm to pinpoint native emission peak wavelength, which is 450.820nm (but was very nearly undetectable).
The raw spectrometer data (comma-delimited that can be loaded into Excel) is at /46/bnr6-r.txt

Spectrographic analysis of the Spooky Halloween Candle; the upright portion here.
The raw spectrometer data (comma-delimited that can be loaded into Excel) is at /43/candl18s.txt
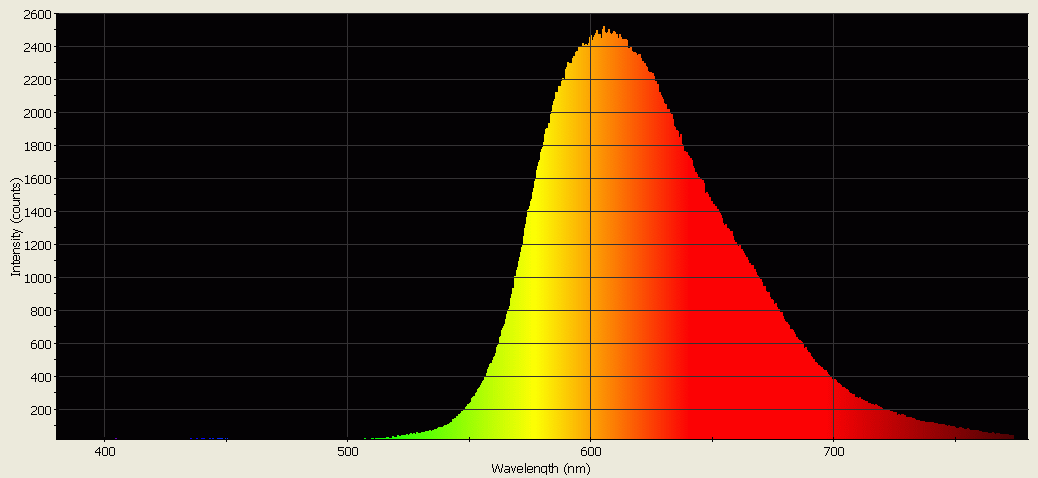
Spectrographic analysis of the Spooky Halloween Candle; the flame portion here.
The raw spectrometer data (comma-delimited that can be loaded into Excel) is at /43/candl18f.txt
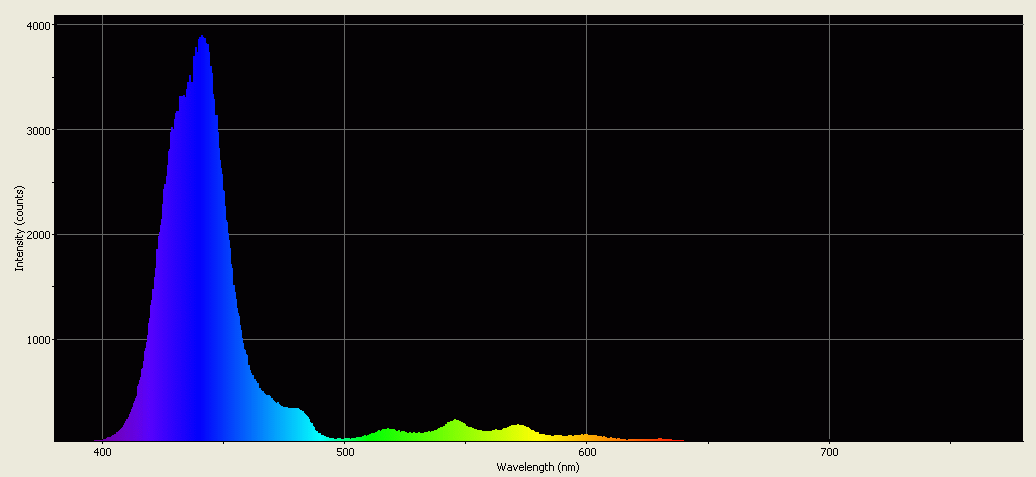
Spectrographic analysis of the Wicked Lasers PhosForce Laser-To-Flashlight Converter when white light was shone into it from the "wrong" end to show the prescence of a dichroic filter.
The raw spectrometer data (comma-delimited that can be loaded into Excel) is at /42/phosfilt.txt
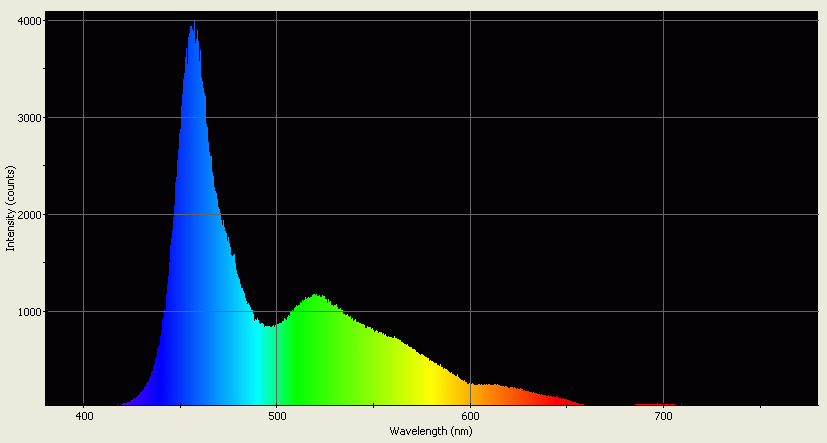
Spectrographic analysis of the filtered white LED in the Light-Up "Star" Ring.
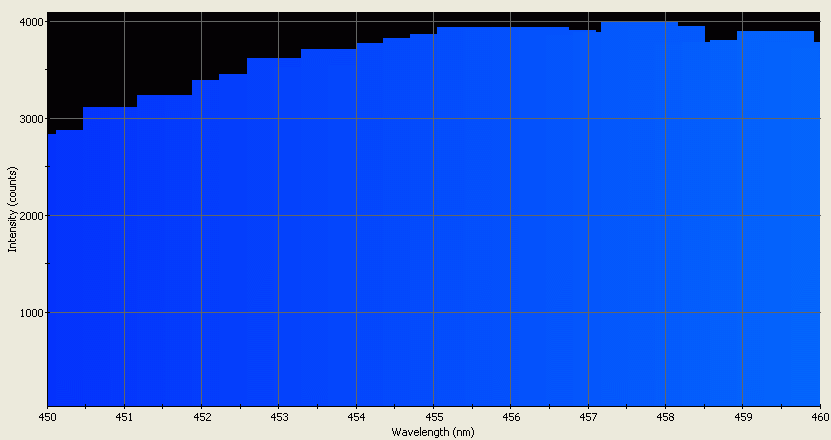
Spectrographic analysis of the filtered white LED in the Light-Up "Star" Ring; spectrometer's response narrowed to a band between 450nm and 460nm to pinpoint native emission peak wavelength, which is 457.170nm.
The raw spectrometer data (comma-delimited that can be loaded into Excel) is at /42/starring.txt
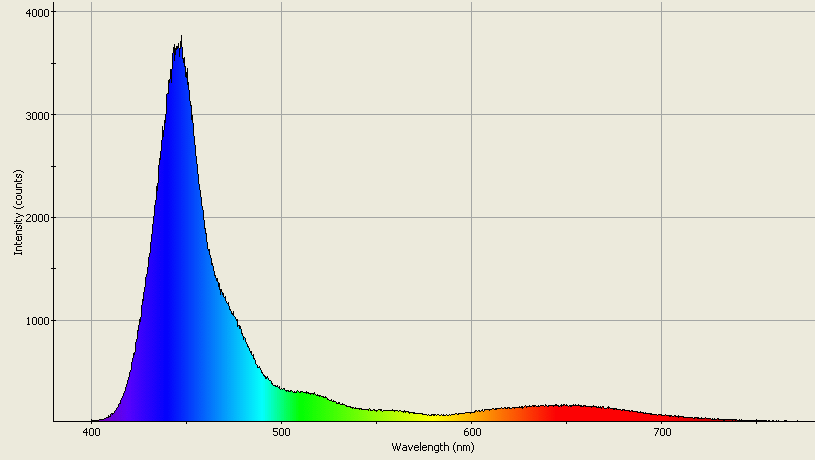
Spectrographic analysis of the purple LED "bulbs" in the Philips Purple LED Faceted Sphere Lights.
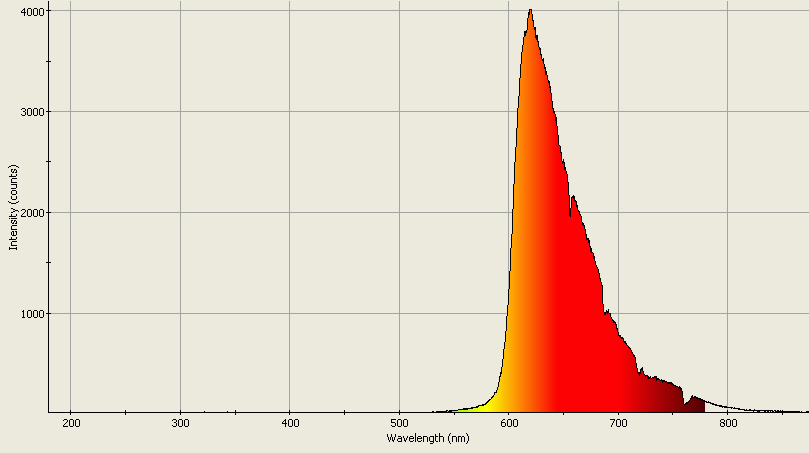
Spectrographic analysis of sunlight filtered by a red Tristar 25A photographic filter.
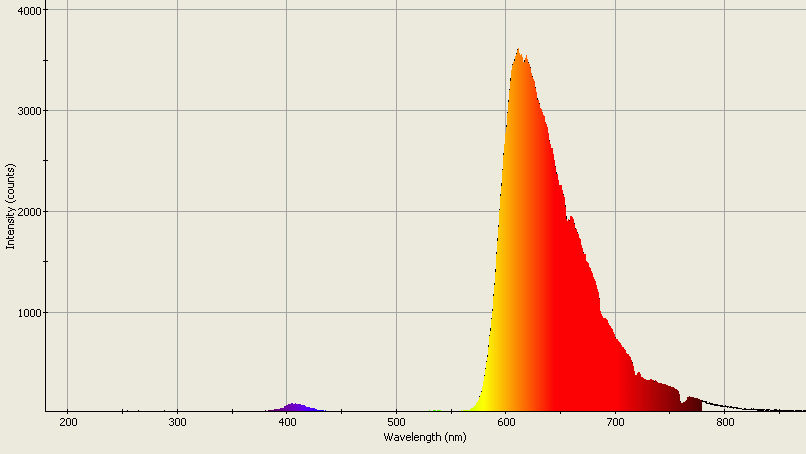
Spectrographic analysis of sunlight with the soft red plastic "bung" that fits on the sensor of the USB2000 Spectrometer.
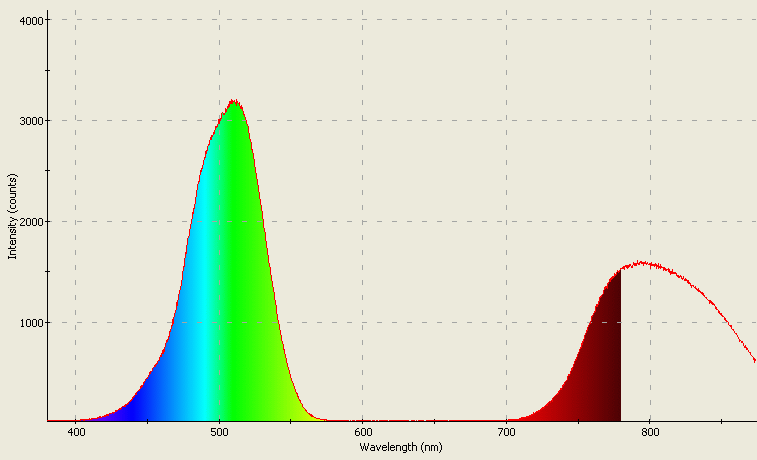
Spectrographic analysis of a GE #D36 Satan Bright incandescent Christmas bulb in blue-green.
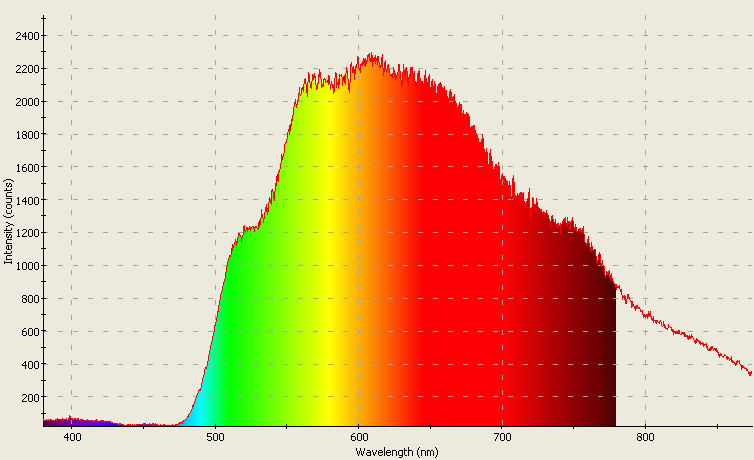
Spectrographic analysis of the bulb in the Halloween Safety Blinker (2).
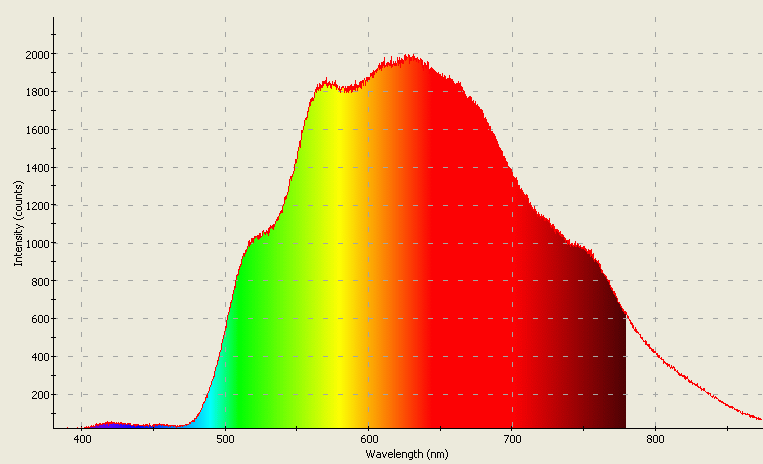
Spectrographic analysis of the bulb in the Halloween Safety Blinker (2); filtered by the skull.
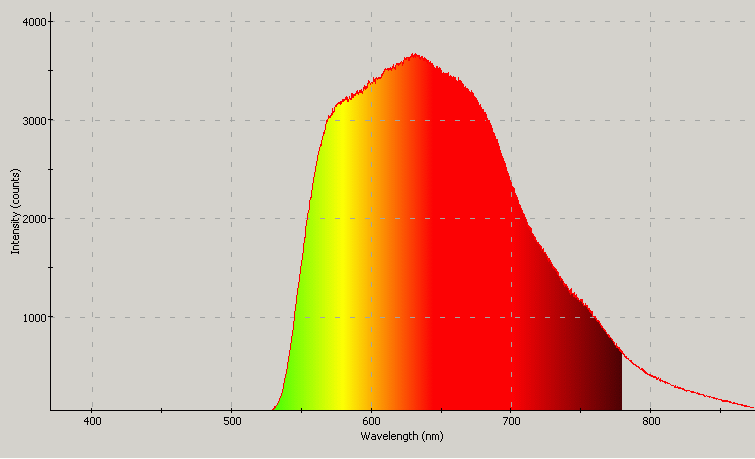
Spectrographic analysis of the incandescent bulb in the Field & Stream Magnet Flashing Light (amber flasher mode).
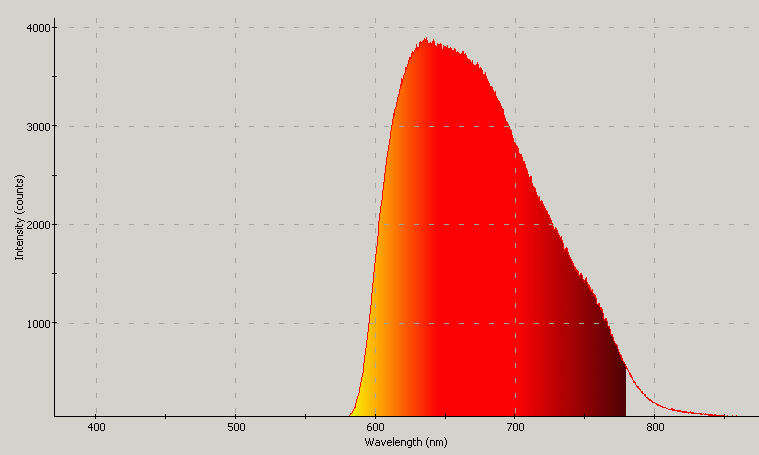
Spectrographic analysis of the incandescent bulb in the Field & Stream Magnet Flashing Light (red flasher mode).
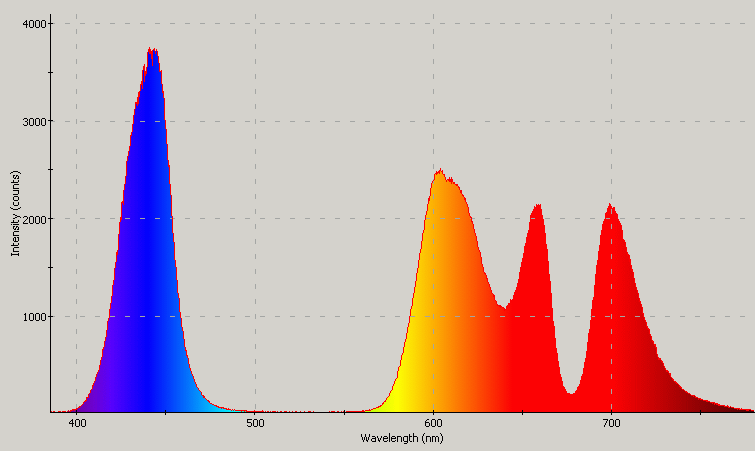
Spectrographic analysis of the LED (both red & blue filters) in the Garrity LED Aluminum Flashlight (2).
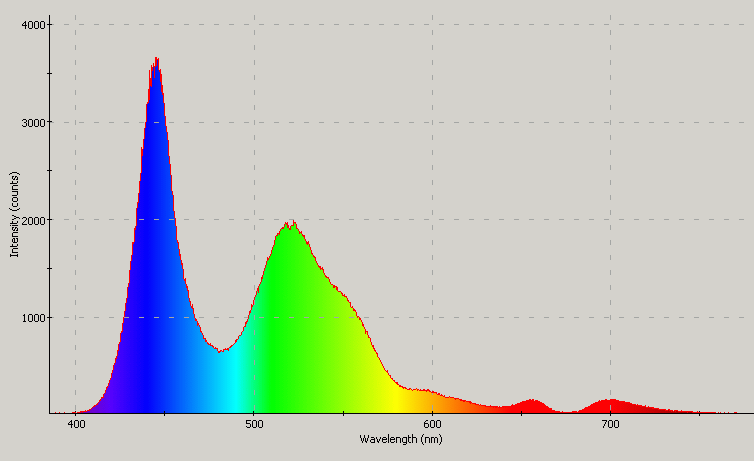
Spectrographic analysis of the LED (blue filter) in the Garrity LED Aluminum Flashlight (2).
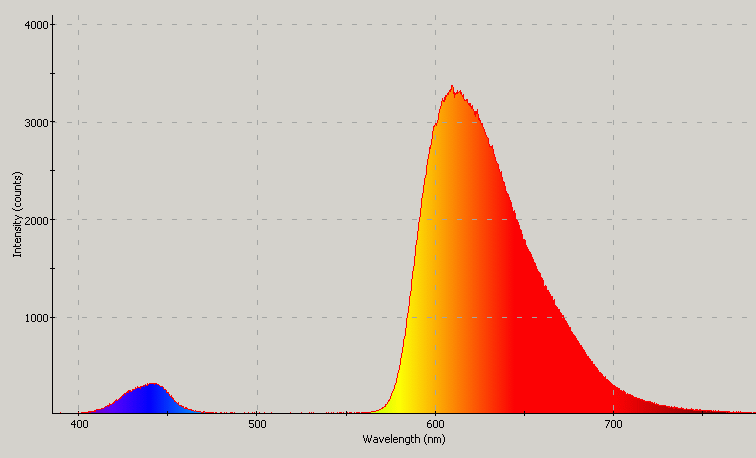
Spectrographic analysis of the LED (red filter) in the Garrity LED Aluminum Flashlight (2).
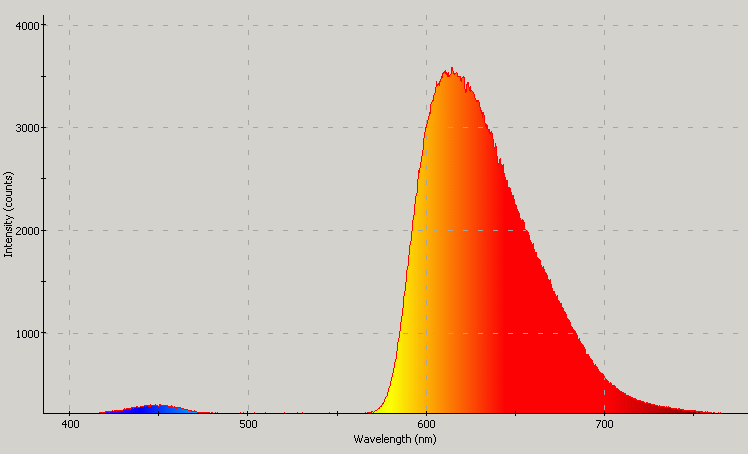
Spectrographic analysis of the LED (red filter) in the Garrity LED Aluminum Flashlight.
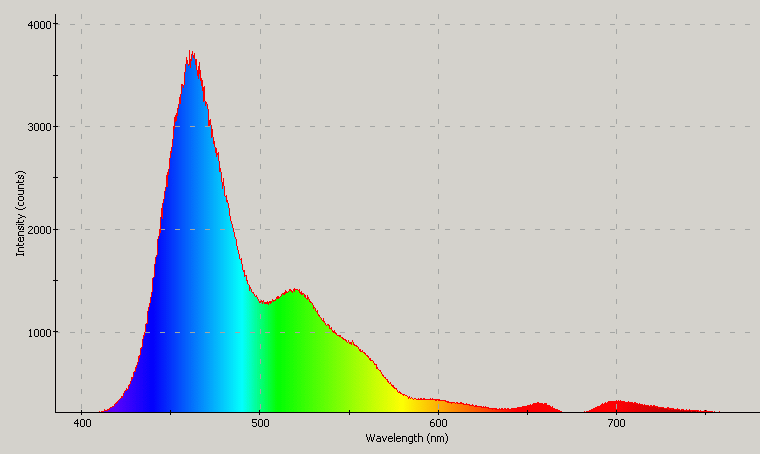
Spectrographic analysis of the LED (blue filter) in the Garrity LED Aluminum Flashlight.
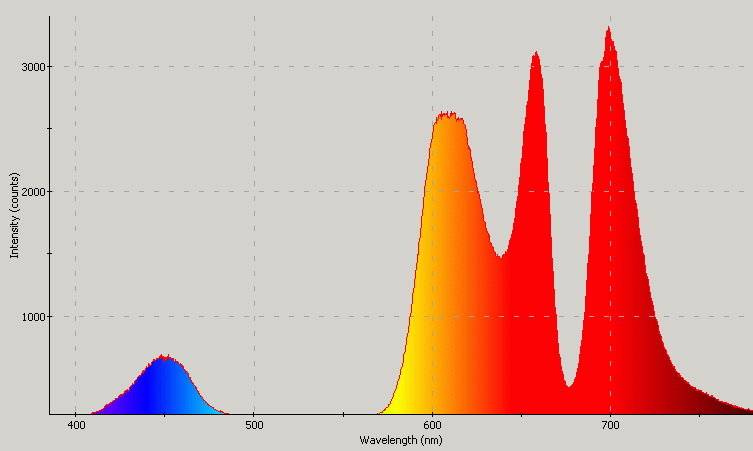
Spectrographic analysis of the LED (both filters) in the Garrity LED Aluminum Flashlight.
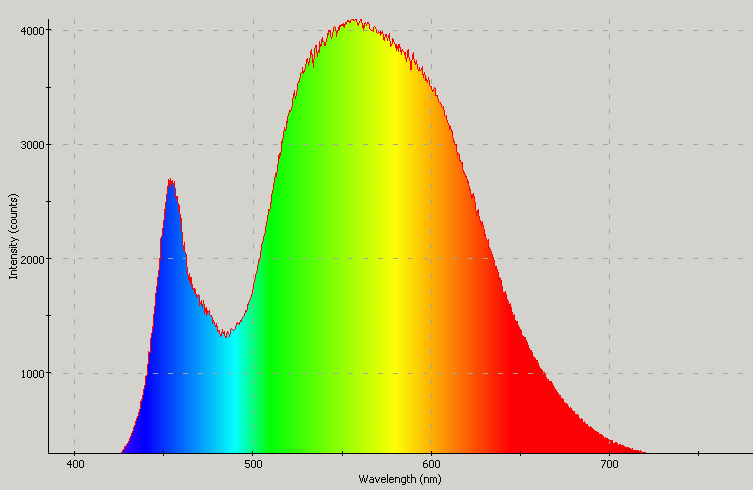
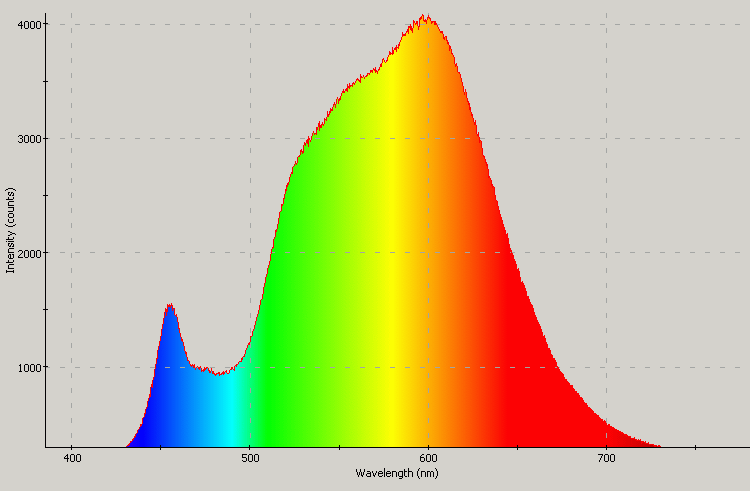
Spectrographic analysis of the LEDs in the ikan iLED 100 Light Kit (lighter orange filter gel used).
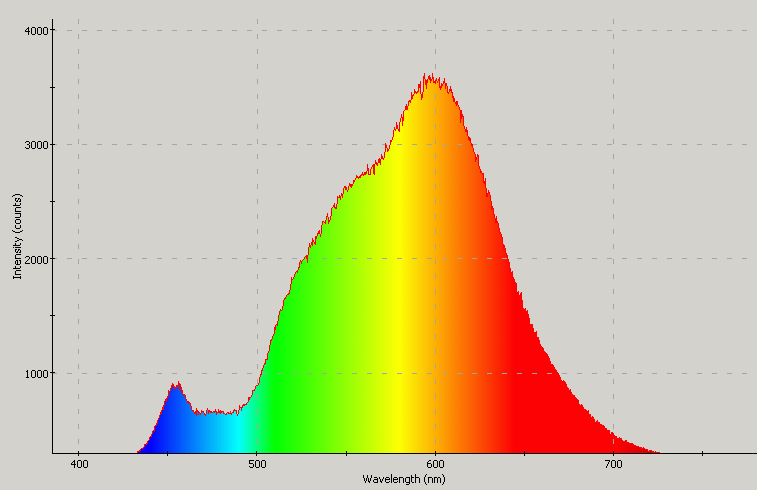
Spectrographic analysis of the LEDs in the ikan iLED 100 Light Kit (darker orange filter gel used).
Spectrographic analysis of the LEDs in the ikan iLED 100 Light Kit (both orange filter gels used).

Spectrographic analysis of the bulb in the Halloween Blinking Safety Light (2).
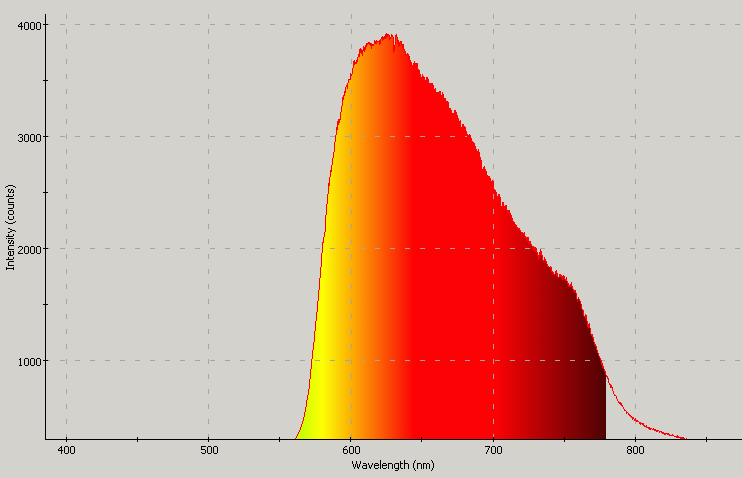
Spectrographic analysis of the bulb (filtered with the red filter) in the Fright Light.
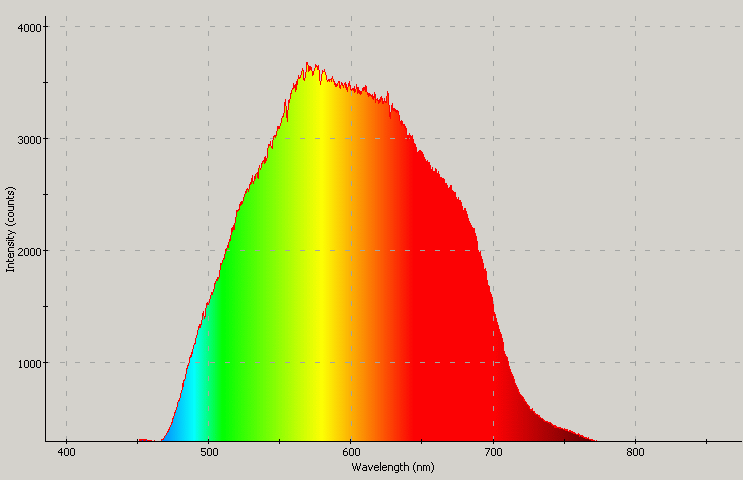
Spectrographic analysis of the bulb (filtered with the yellow filter) in the Fright Light.
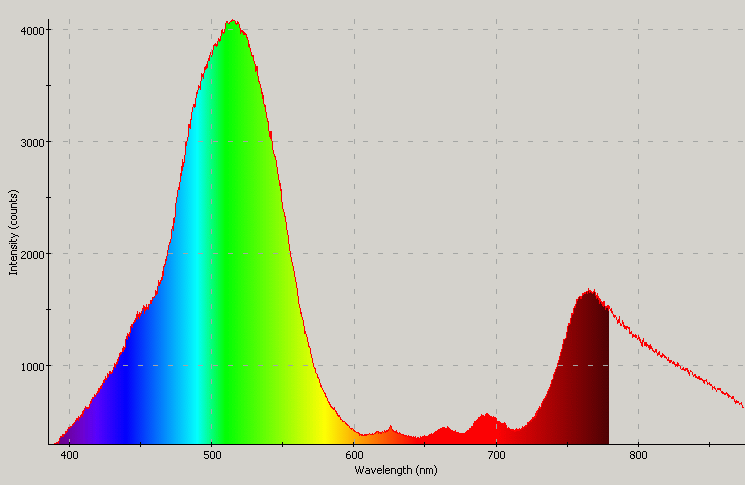
Spectrographic analysis of the bulb (filtered with the blue filter) in the Fright Light.
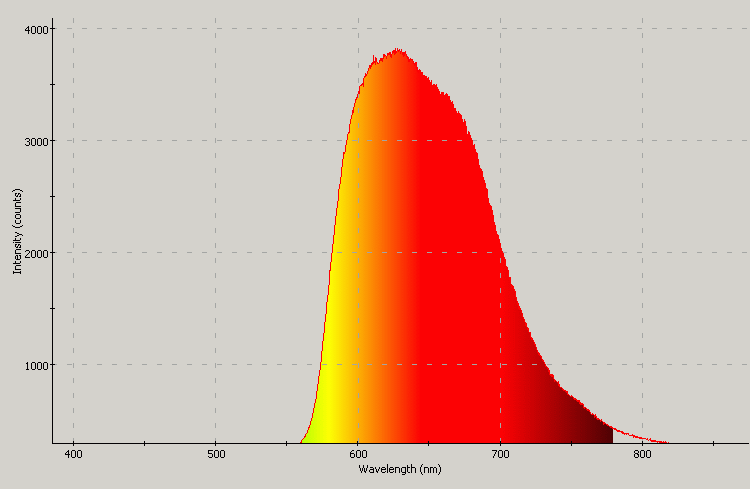
Spectrographic analysis of the bulb (filtered with the red & yellow filters) in the Fright Light.
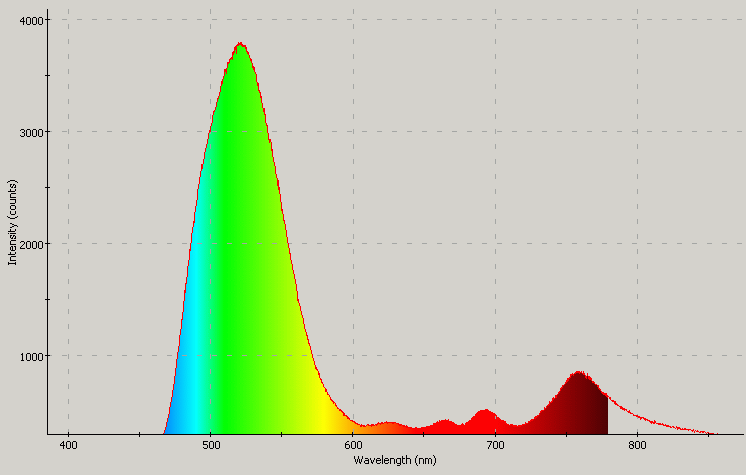
Spectrographic analysis of the bulb (filtered with the yellow & blue filters) in the Fright Light.
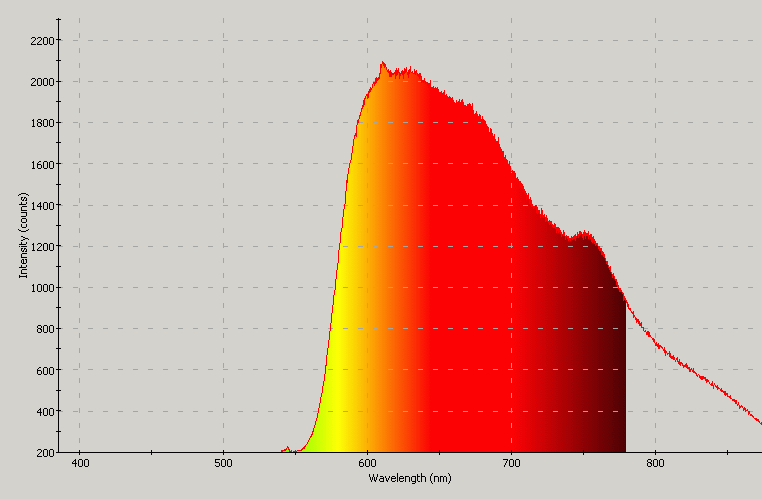
Spectrographic analysis of the bulb in the Halloween Safety Blinker, filtered by the slide-up Jack-O-Lantern.
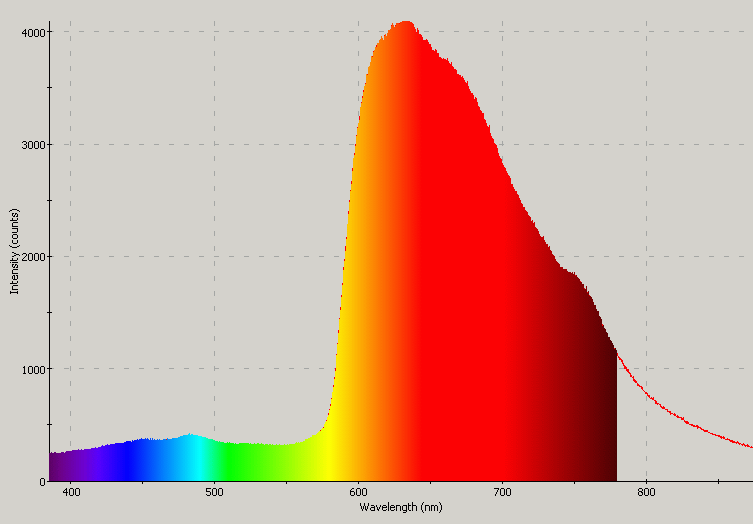
Spectrographic analysis of the "Trixar" red filter (from a box of Trix cereal); filtering the low-intensity incandescent lamp in my SureFire 10X Dominator.
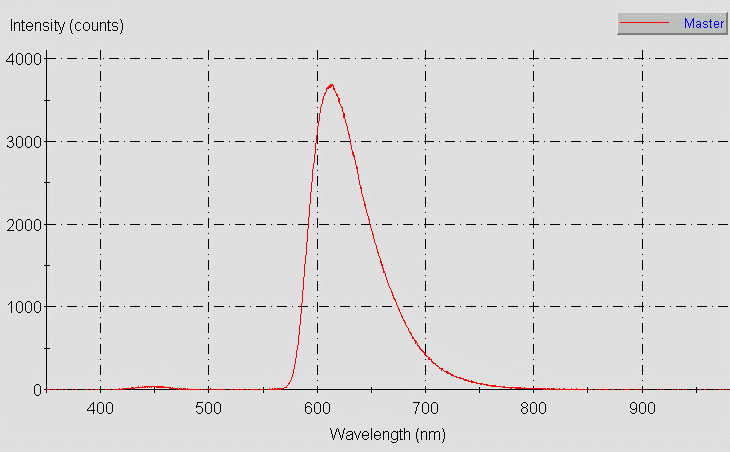
Spectrographic analysis of the LED (red filter) in the Garrity Aluminum Flashlight.
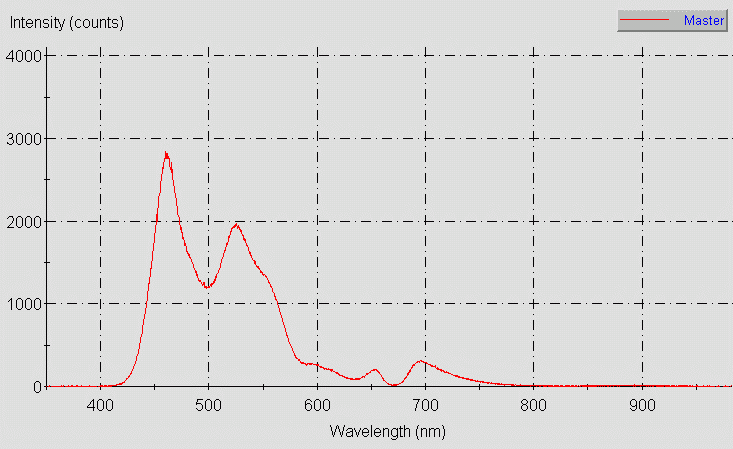
Spectrographic analysis of the LED (blue filter) in the Garrity Aluminum Flashlight.
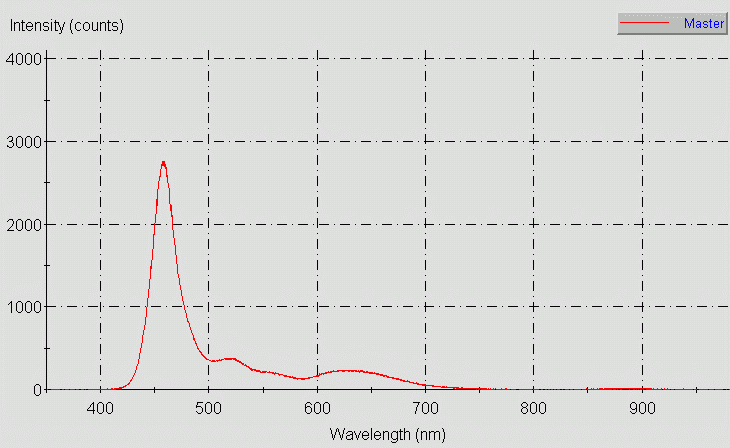
Spectrographic analysis of one of the LED bulbs in the Philips LED Halloween Lights.
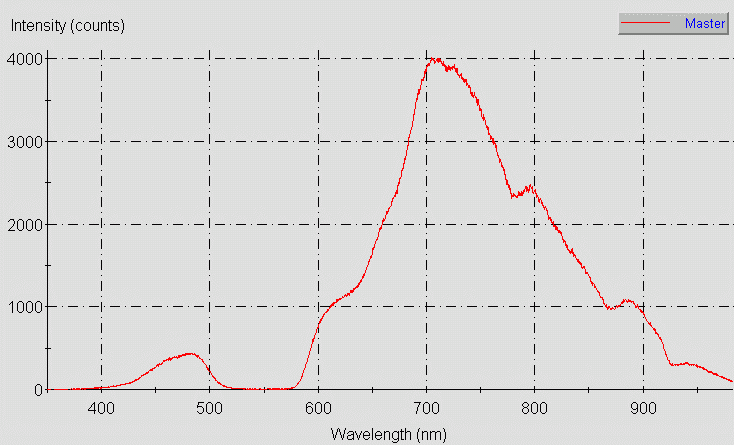
Spectrographic analysis of one of the light bulbs in the Spider Web Lights.
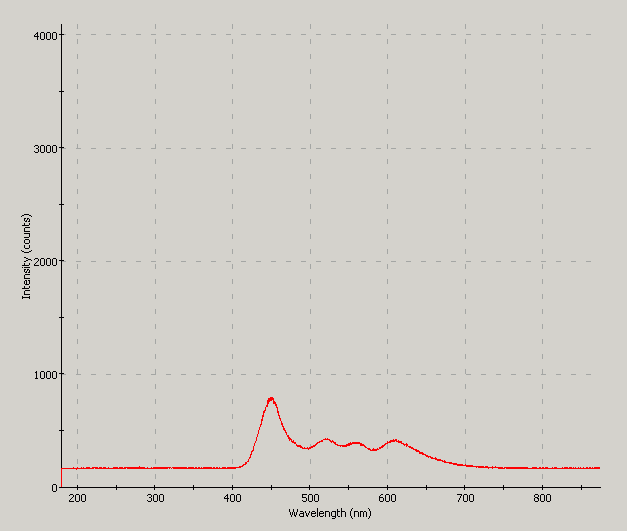
Spectrographic analysis of one of the "purple" lamps in the Forever Bright Christmas Lights (2).
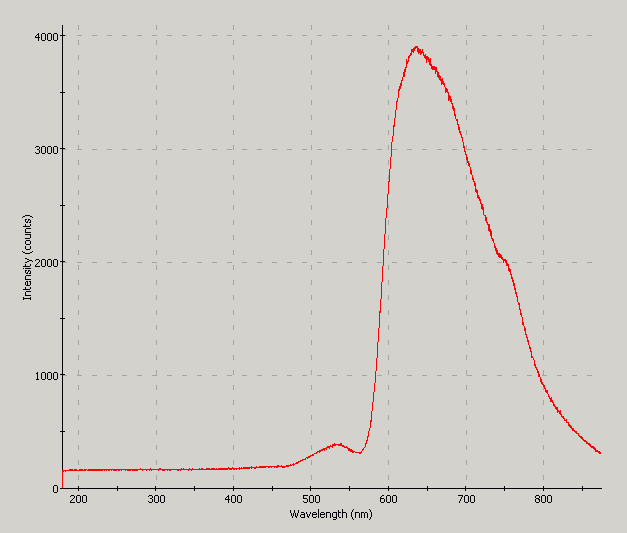
Spectrographic analysis of a red "party" incandescent light bulb.
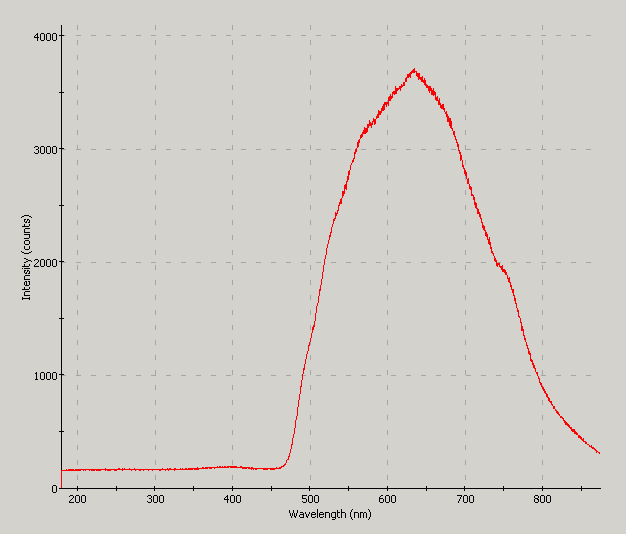
Spectrographic analysis of a yellow "party" incandescent light bulb.
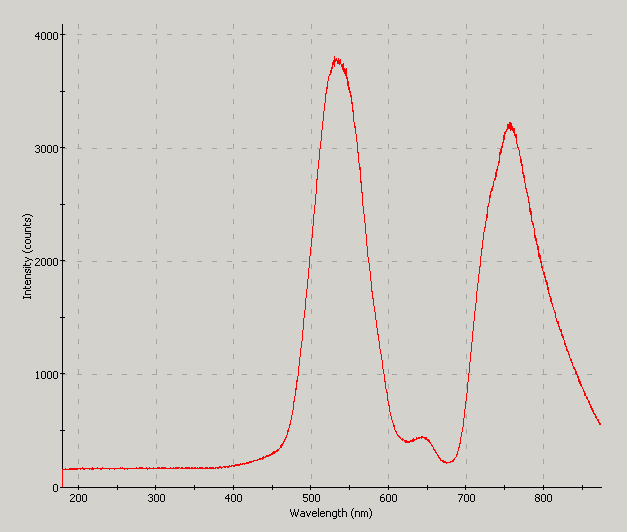
Spectrographic analysis of a green "party" incandescent light bulb.
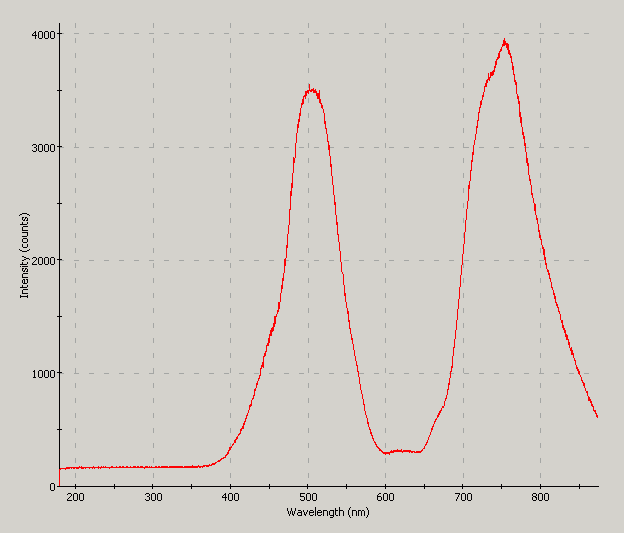
Spectrographic analysis of a blue "party" incandescent light bulb.
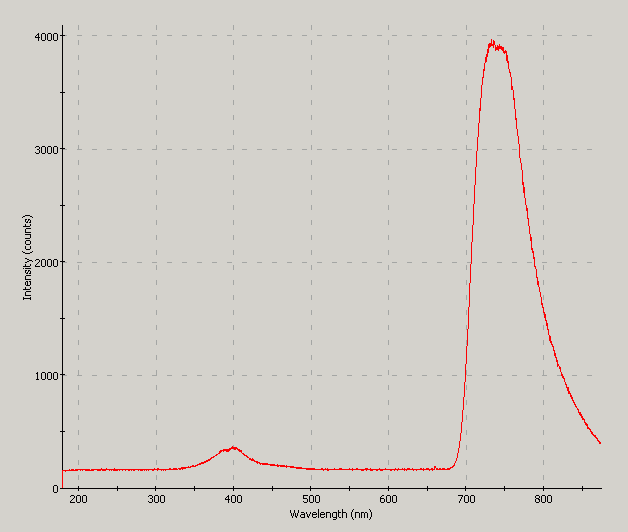
Spectrographic analysis of an incandescent "black lite" bulb.
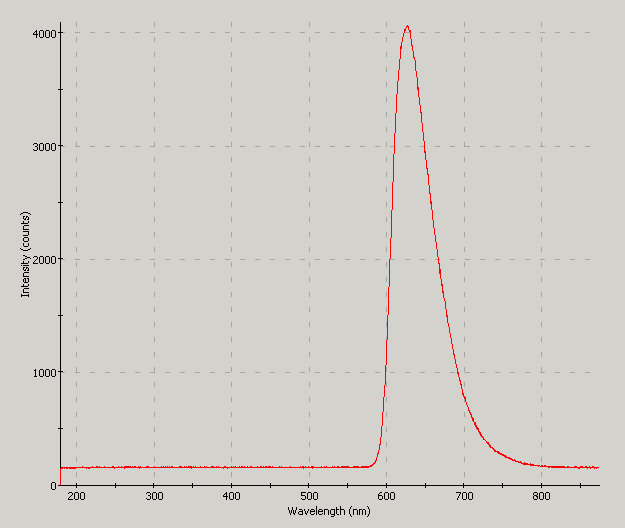
Spectrum of the red filtered LED in a Gerber Recon Flashlight.
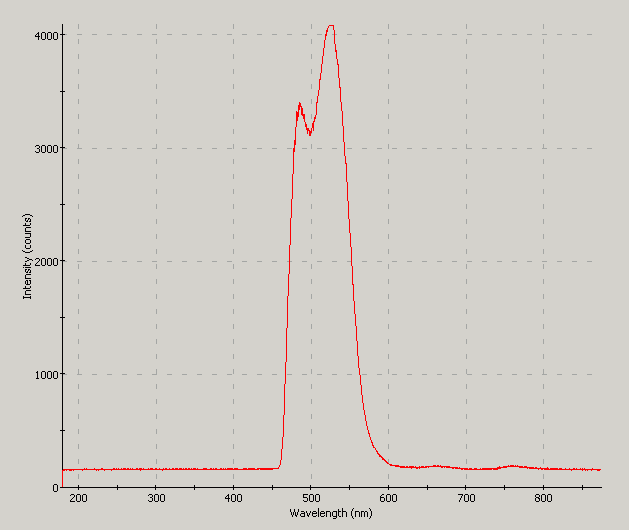
Spectrum of the green filtered LED in a Gerber Recon Flashlight.
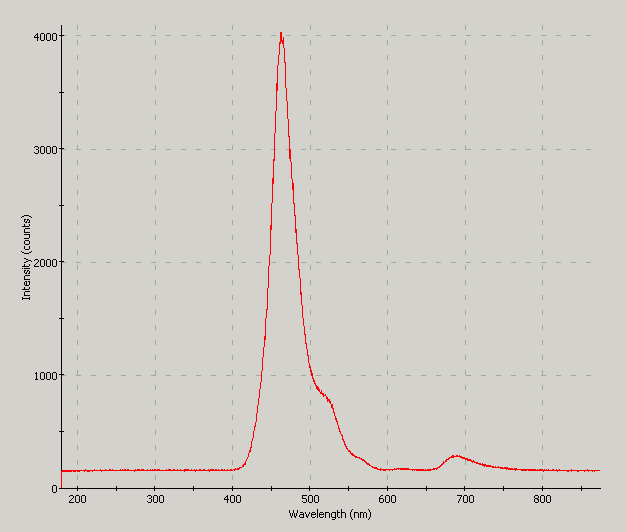
Spectrum of the blue filtered LED in a Gerber Recon Flashlight.
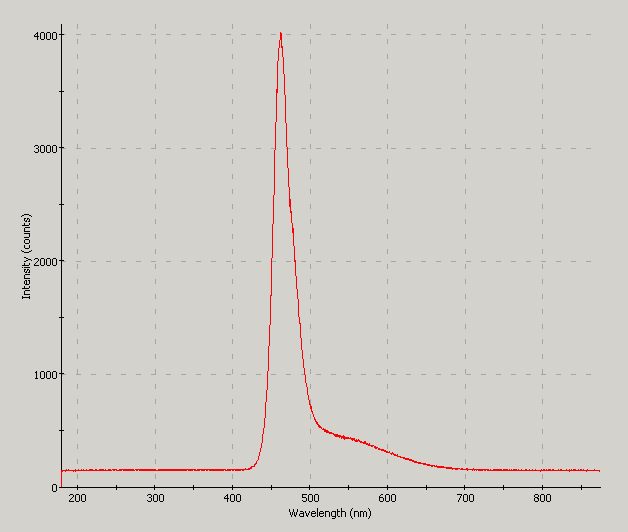
Spectrum of a blue LED with a White Cap LED Condom over it.
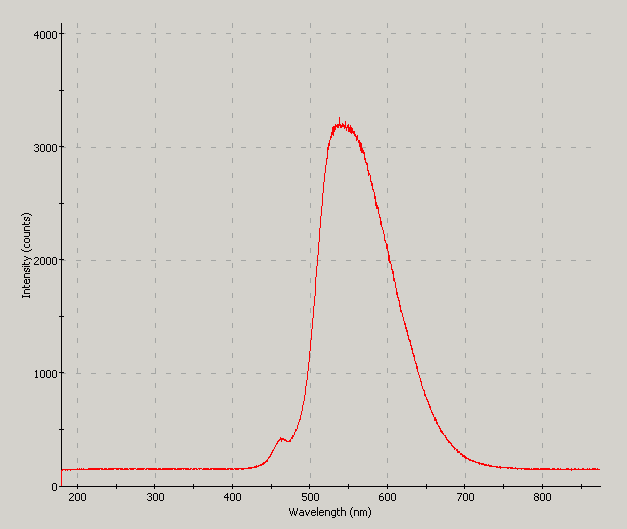
Spectrum of a blue LED with a White Cap LED Filter over it.
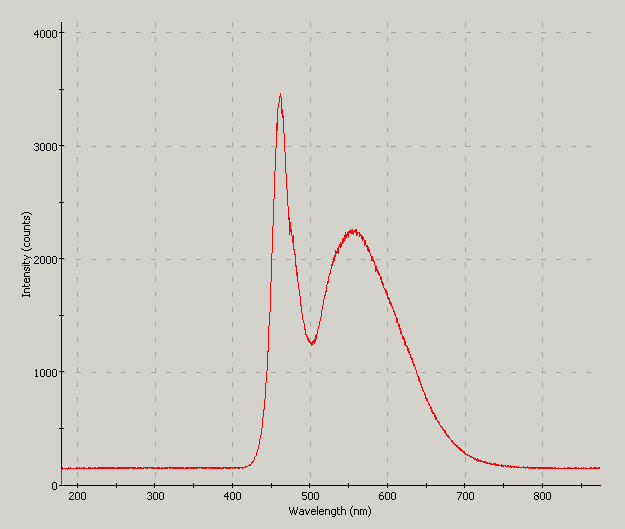
Spectrum of a blue LED with a White Cap LED Filter over it.
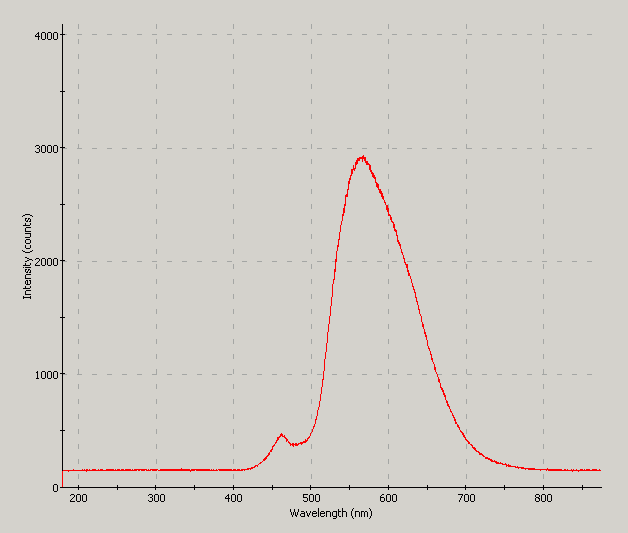
Spectrum of a blue LED with a White Cap LED Filter over it.
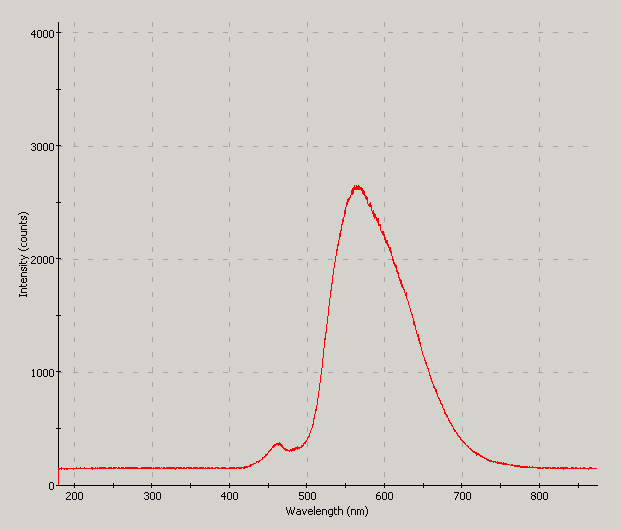
Spectrum of a blue LED with a White Cap LED Filter over it.
All White Cap spectra were taken using a Nichia NSPB520BS 3mm blue LED.
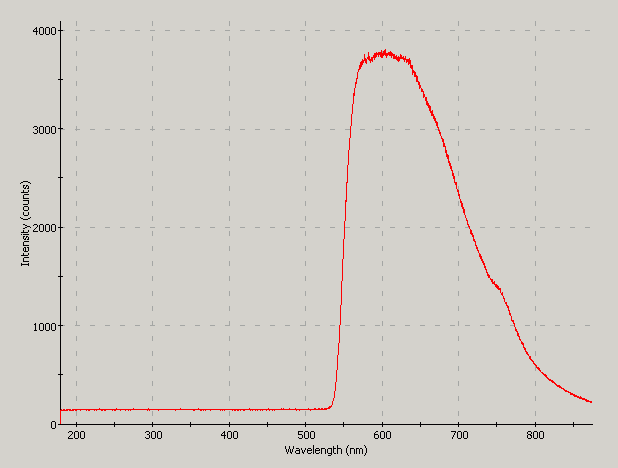
Spectrum of an incandescent lamp filtered with Coherent argon
laser safety goggles; advertised as "OD 5 at 515nm and below".