
Spectrographic analysis of the OLEDs in the Holy Stone HS550 Brushless 4K Drone's radio.
I don't see OLEDs that often; that's why I performed spectroscopy of these.
The raw spectrometer data (tab-delimited that can be loaded into Excel) is at hs550.txt
Spectrographic analysis of the OLEDs in the Holy Stone HS720E 4K EIS UHD Brushless GPS Drone's radio.
I don't see OLEDs that often; that's why I performed spectroscopy of these.
The raw spectrometer data (tab-delimited that can be loaded into Excel) is at hs720e.txt
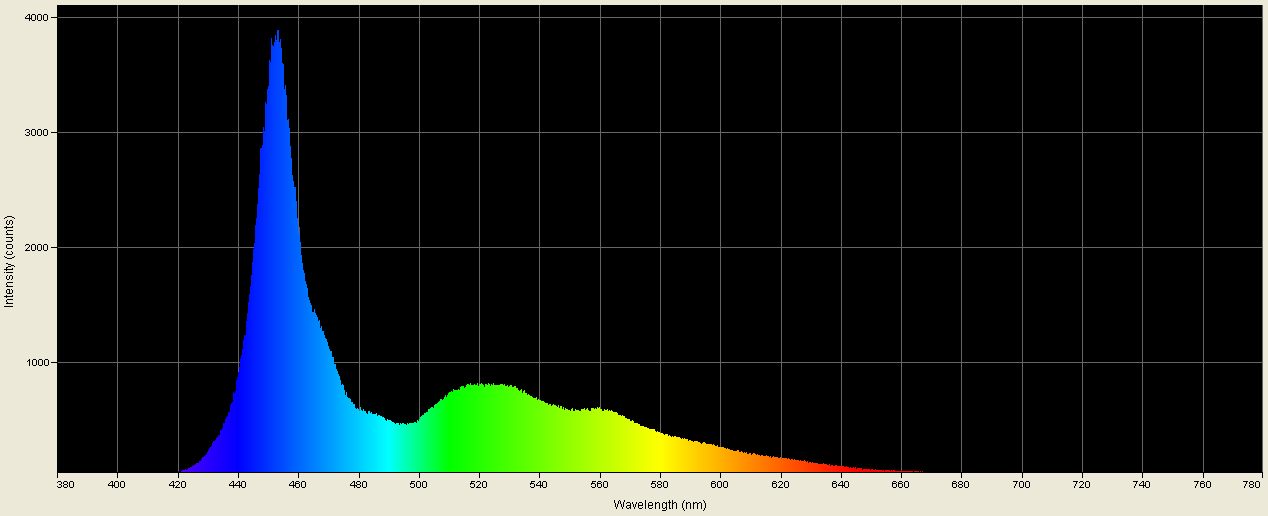
Spectrographic analysis of the OLED display in the radio of the JJR/C JJPRO X5 "EPIK" Brushless 5G WiFi FPV GPS R/C Drone.
Spectrographic analysis of the OLED display in the radio of the JJR/C JJPRO X5 "EPIK" Brushless 5G WiFi FPV GPS R/C Drone; spectrometer's response narrowed to a band between 445nm and 465nm to pinpoint native emission peak wavelength, which is 453.290nm.
The raw spectrometer data (tab-delimited that can be loaded into Excel) is at epik.txt
Spectrographic analysis of the OLEDs in the Choicemmed Oxywatch C20 Pulse Oximeterd's display.
The raw spectrometer data (tab-delimited that can be loaded into Excel) is at http://tllm.site/45/oximeter.txt
Spectrographic analysis of the OLED screen (displaying red) in the OLED Digital Photo Frame.
Spectrographic analysis of the OLED screen (displaying red) in the OLED Digital Photo Frame; spectrometer's response narrowed to a band between 590nm and 640nm to pinpoint peak wavelength, which is 603.411nm.
Spectrographic analysis of the OLED screen (displaying green) in the OLED Digital Photo Frame.
Spectrographic analysis of the OLED screen (displaying green) in the OLED Digital Photo Frame; spectrometer's response narrowed to a band between 490nm and 540nm to pinpoint peak wavelength, which is 539.115nm.
Spectrographic analysis of the OLED screen (displaying blue) in the OLED Digital Photo Frame.
Spectrographic analysis of the OLED screen (displaying blue) in the OLED Digital Photo Frame; spectrometer's response narrowed to a band between 430nm and 480nm to pinpoint peak wavelength, which is 449.850nm.
Spectrographic analysis of the OLED screen (displaying white) in thhe OLED Digital Photo Frame.