Spectrographic analysis of another one of these LEDs (randomly cut from a second package of these LEDs) at If=150mA.
Look at the emission in the violet.
Peak wavelength here is 412.150nm.
I'm again uncertain whether this is a true phosphor emission (this ***IS*** an anti-Stokes phosphor that we're dealing with here!) or a harmonic in the spectrometer's grating.
The raw spectrometer data (tab-delimited that can be loaded into Excel) for the wavelength range of 380nm to 470nm is at asgreen6.txt

Spectrographic analysis of another one of these LEDs (randomly cut from a second package of these LEDs) at If=10mA.
I just wanted to see if the red phosphor emission was present in this sample. Yup, there it is.

Spectrographic analysis of the above LED at If=150mA.
Look at the emission in the blue and especially the violet.
I'm uncertain whether this is a true phosphor emission (this ***IS*** an anti-Stokes phosphor that we're dealing with here!) or a harmonic in the spectrometer's grating.
The raw spectrometer data (tab-delimited that can be loaded into Excel) for the wavelength range of 380nm to 470nm is at asgreen5.txt

Spectrographic analysis of another one of these LEDs (randomly cut from the packaging materials) at If=10mA.
I just wanted to see if the red phosphor emission was present in this sample. Yup, there it is.

Spectrographic analysis of one of these LEDs (randomly cut from the packaging materials) at If=10mA.
I just wanted to see if the red phosphor emission was present in this sample. Yup, there it is.

Spectrographic analysis of one of these LEDs from a different batch to see if the red phosphor emission goes away (it didn't).

Spectrographic analysis of one of these LEDs from a different batch (If=10mA); spectrometer's response narrowed to a band between 545nm and 565nm to pinpoint green phosphor emission peak wavelength, which is 547.790nm.

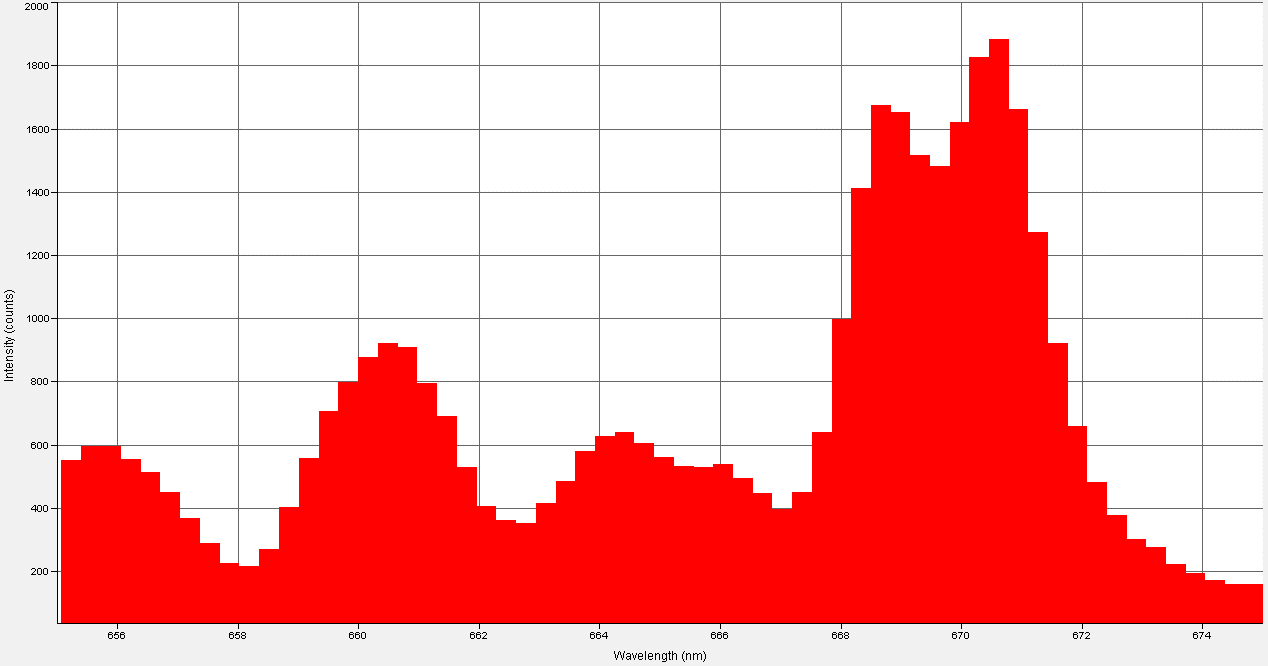
Spectrographic analysis of one of these LEDs from a different batch (If=10mA); spectrometer's response narrowed to a band between 655nm and 675nm to pinpoint red phosphor emission peak wavelength, which is 660.660nm.
The raw spectrometer data (tab-delimited that can be loaded into Excel) is at asgreen3.txt

Spectrographic analysis of one of these LEDs at If=150mA from a different batch.

Spectrographic analysis of one of these LEDs at If=150mA from a different batch; spectrometer's response narrowed to a band between 540nm and 560nm to pinpoint green phosphor emission peak wavelengths, which are 547.100nm and 553.250nm.

Spectrographic analysis of one of these LEDs at If=150mA from a different batch; spectrometer's response narrowed to a band between 655nm and 675nm to pinpoint red phosphor emission peak wavelength (of the highest peak), which is 660.00nm.
The expected level of wavelength drift did not occur with the LED randomly selected from this batch; I have no explanation so please save your breath (don't ask).
The raw spectrometer data (tab-delimited that can be loaded into Excel) is at asgreen4.txt

Spectrographic analysis of one of these LEDs (If=2mA); spectrometer's response narrowed to a band between 545nm and 565nm to pinpoint green phosphor emission peak wavelength, which is 553.940nm.

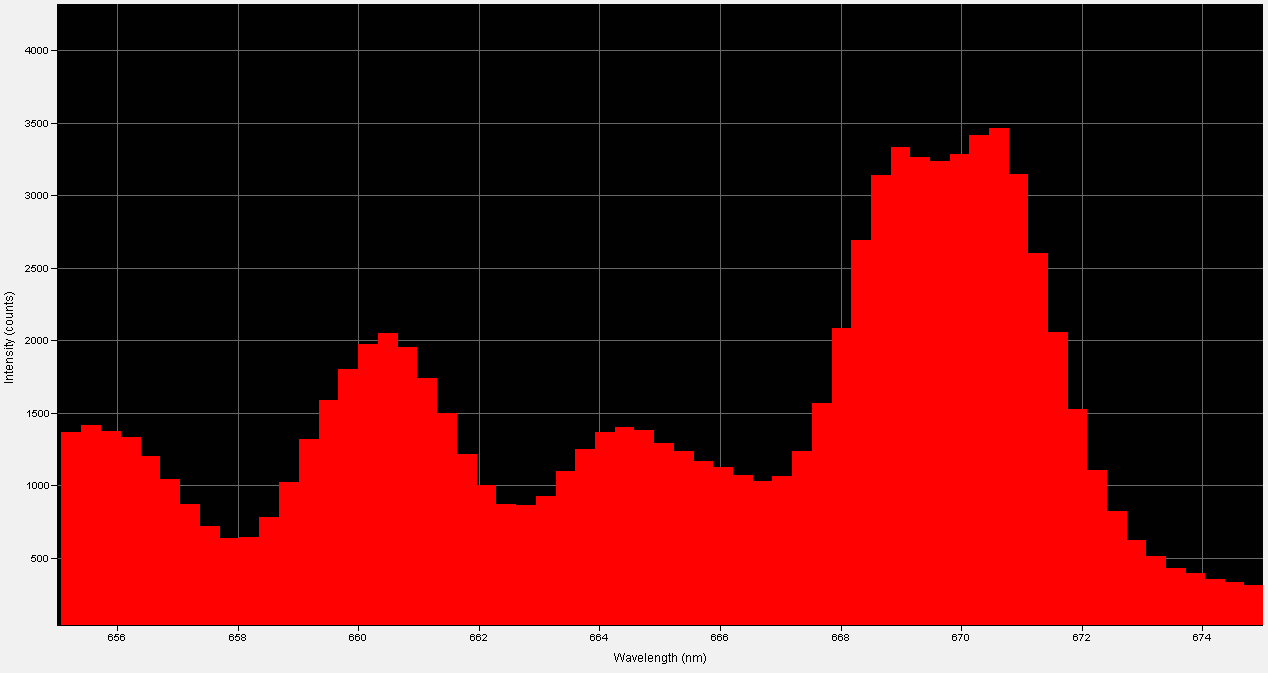
Spectrographic analysis of one of these LEDs (If=2mA); spectrometer's response narrowed to a band between 655nm and 675nm to pinpoint red phosphor emission peak wavelength, which is 670.460nm.
This shows that decreasing the If lengthens the wavelength.
The raw spectrometer data (tab-delimited that can be loaded into Excel) is at asgreen3.txt

Spectrographic analysis of one of these LEDs (If=150mA); spectrometer's response narrowed to a band between 545nm and 565nm to pinpoint green phosphor emission peak wavelength, which is 552.910nm.

Spectrographic analysis of one of these LEDs (If=150mA); spectrometer's response narrowed to a band between 655nm and 675nm to pinpoint red phosphor emission peak wavelength, which is 659.670nm.
This shows that increasing the If shortens the wavelength.
The raw spectrometer data (tab-delimited that can be loaded into Excel) is at asgreen2.txt

Spectrographic analysis of one of these LEDs; spectrometer's response narrowed to a band between 780nm and 874nm (which is the deepest in the IR that my spectrometer can dig into) to resolve several queer NIR emissions.
LED was driven at 70mA this time.

Spectrographic analysis of one of these LEDs.

Spectrographic analysis of one of these LEDs; spectrometer's response narrowed to a band between 545nm and 565nm to pinpoint green phosphor emission peak wavelength, which is 555.640nm.

Spectrographic analysis of one of these LEDs; spectrometer's response narrowed to a band between 660nm and 680nm to pinpoint red phosphor emission peak wavelength, which is 671.440nm.

Spectrographic analysis of one of these LEDs; spectrometer's response narrowed to a band between 780nm and 874nm (which is the deepest in the IR that my spectrometer can dig into) to resolve several queer NIR emissions.
The raw spectrometer data (tab-delimited that can be loaded into Excel) is at asgreen.txt
